| UI Institute of Earth Sciences
GPS time series |
|---|
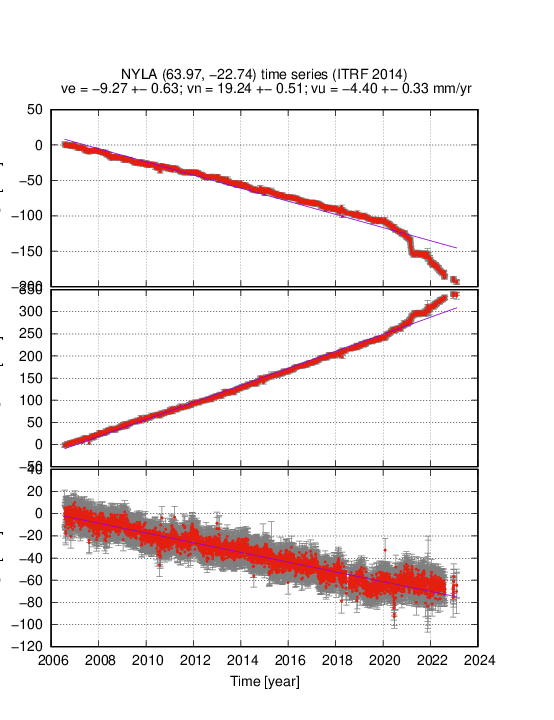
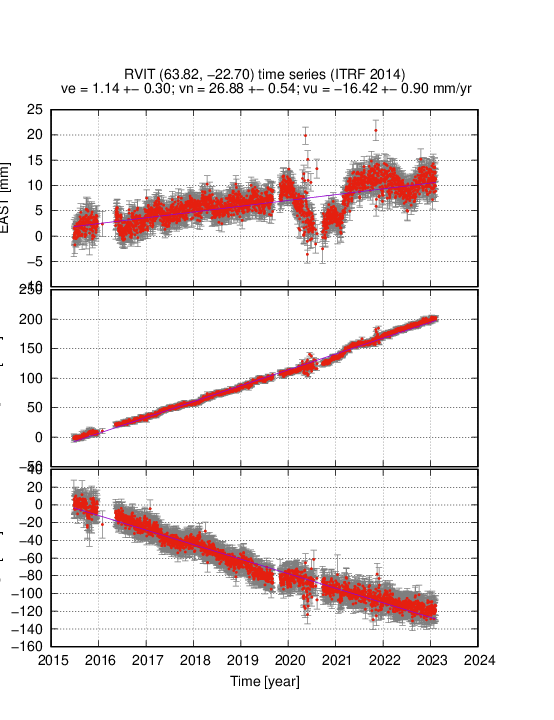
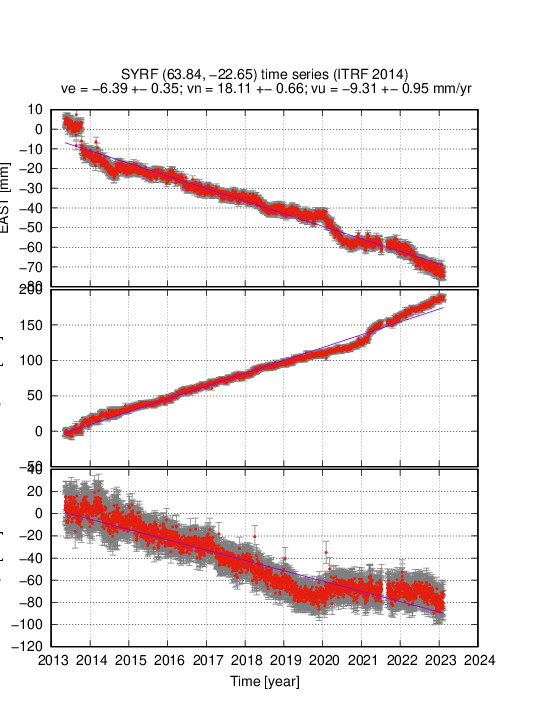
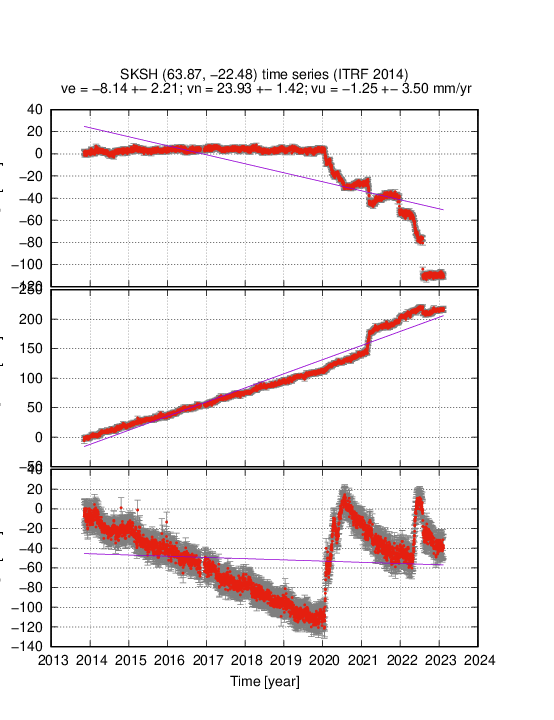
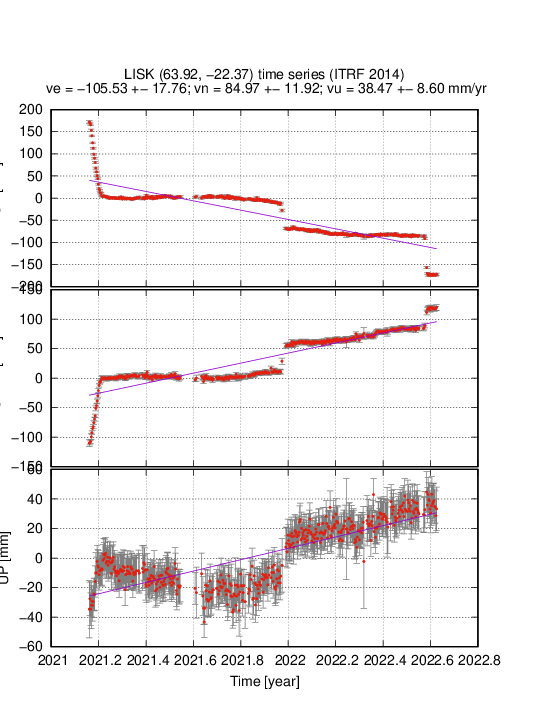
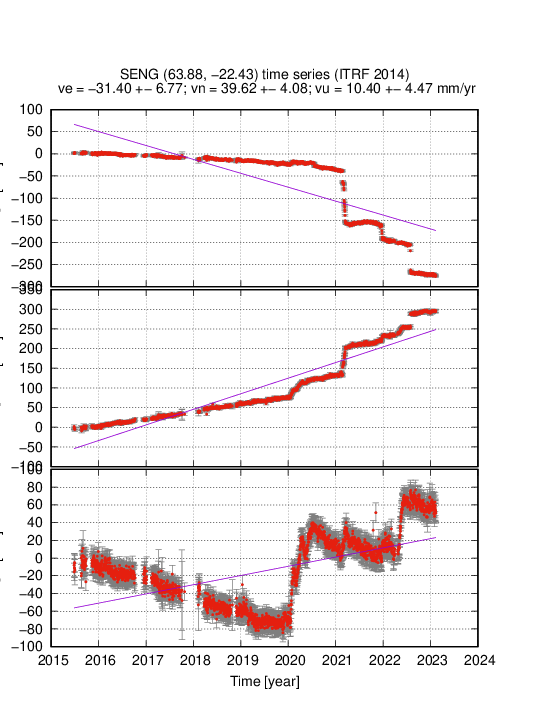
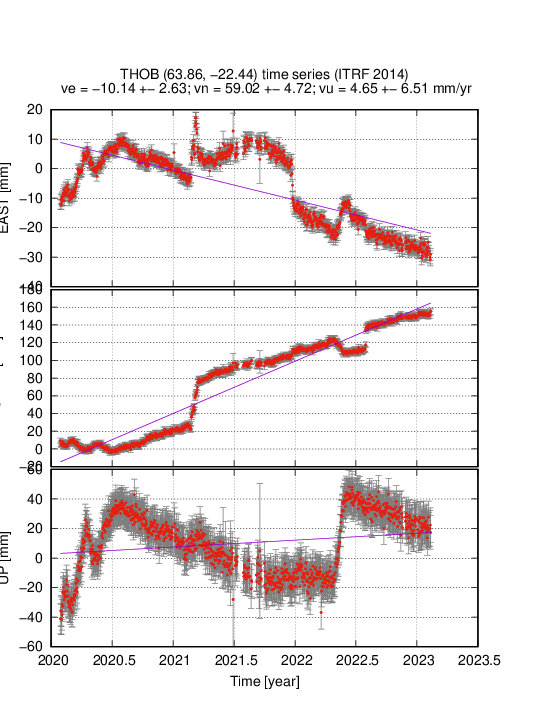
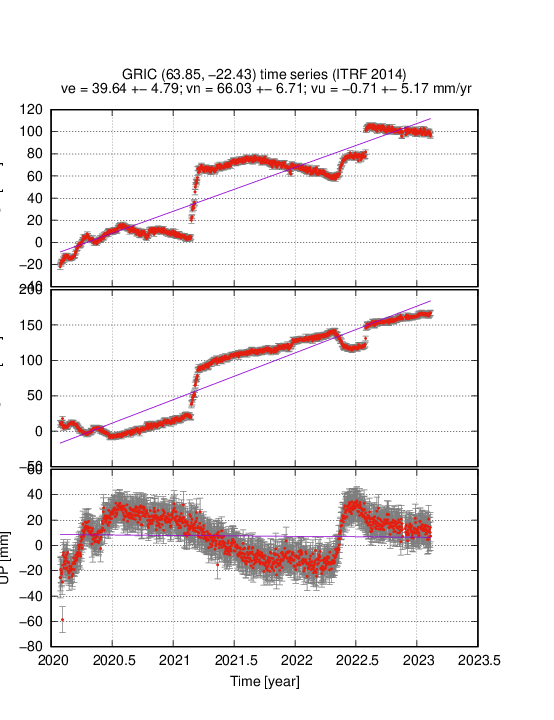
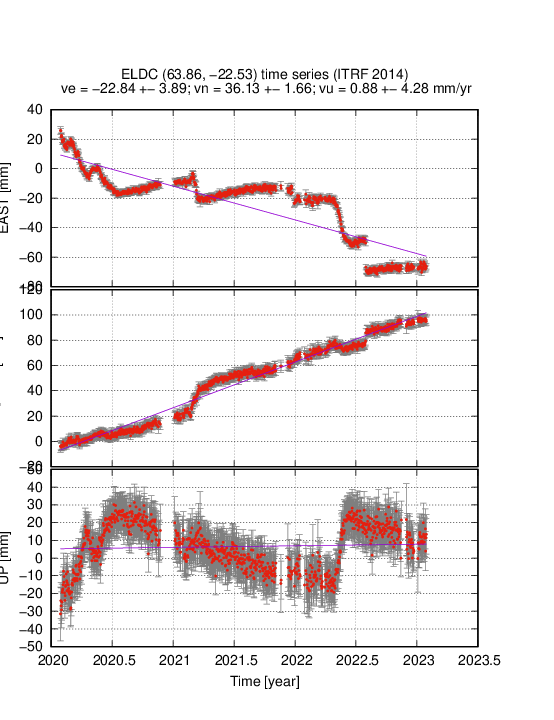
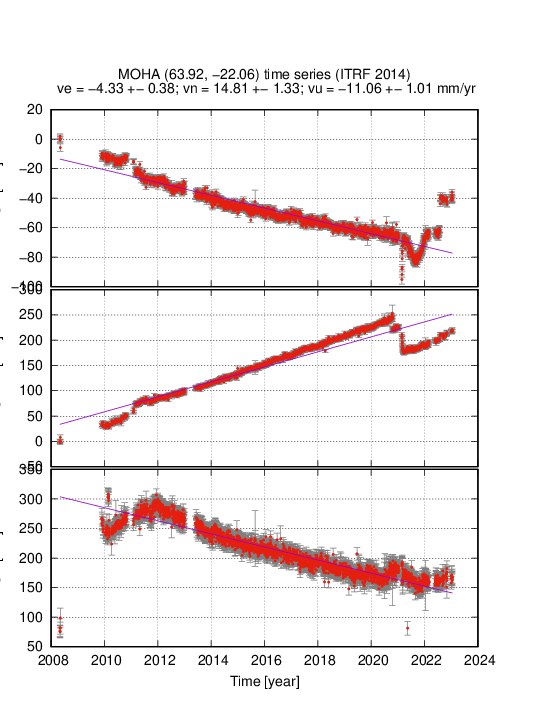
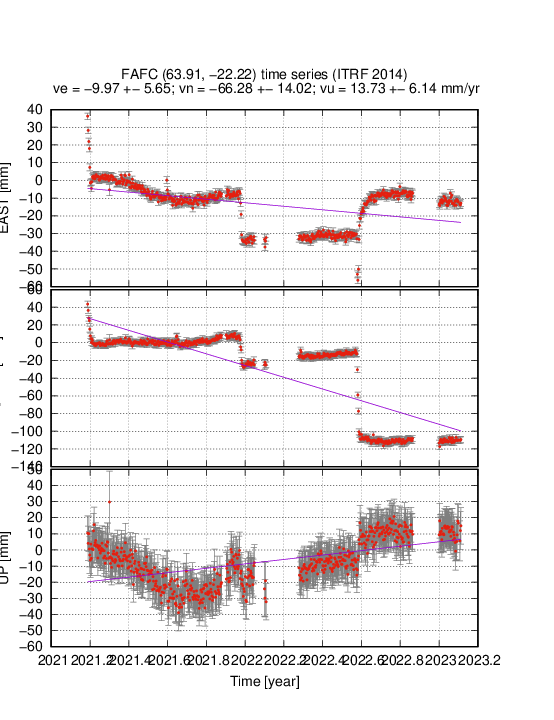
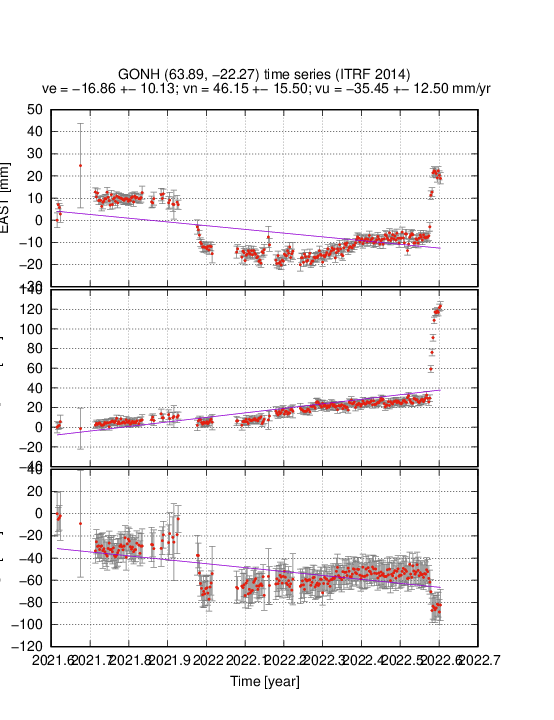
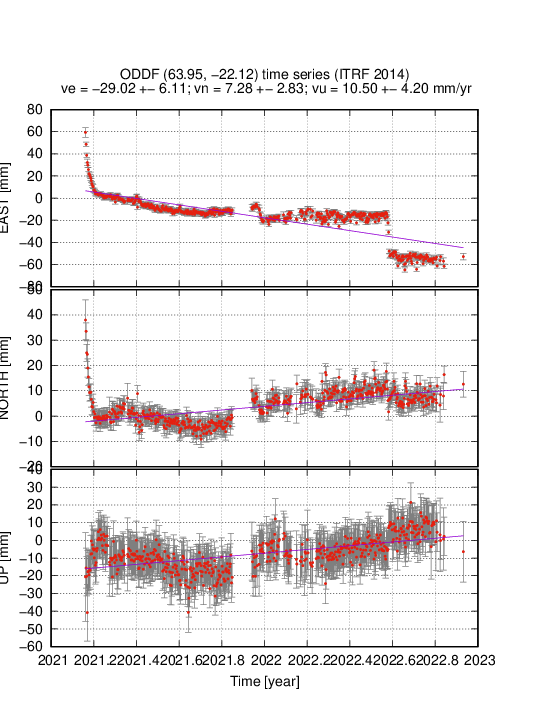
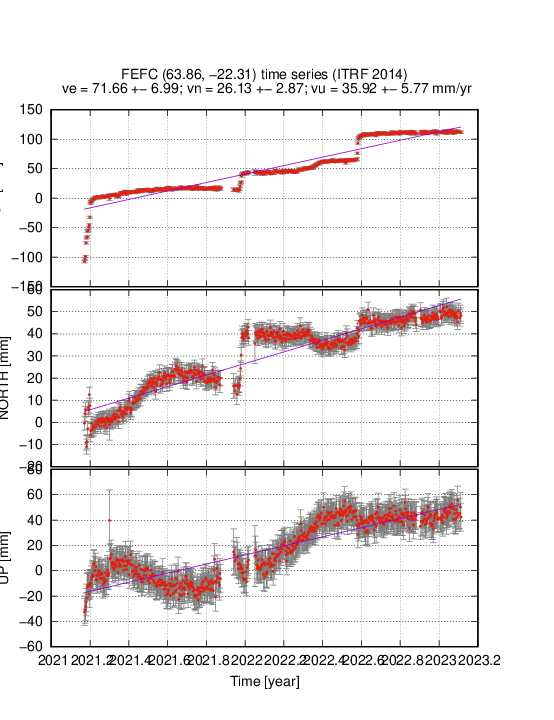
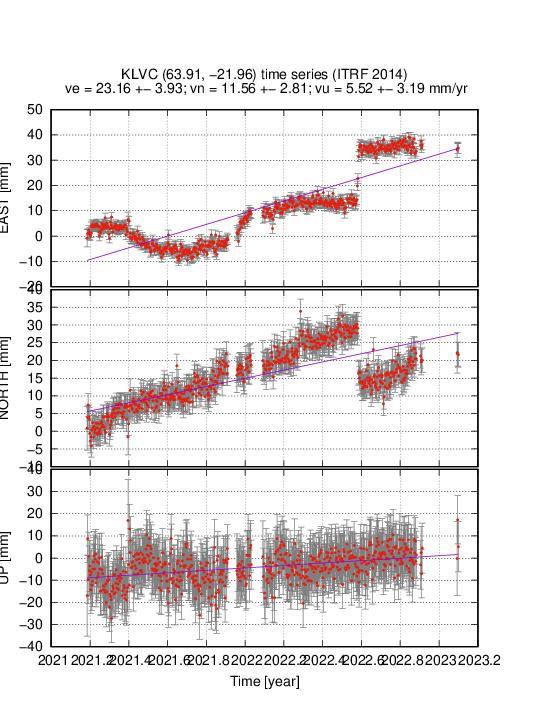
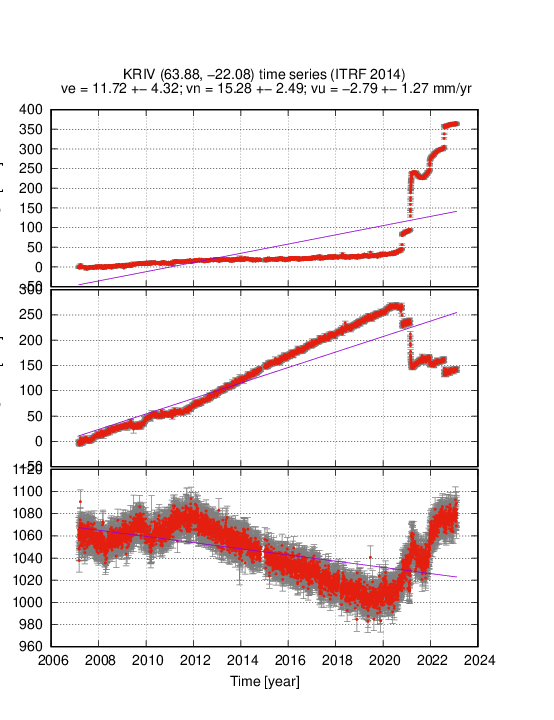
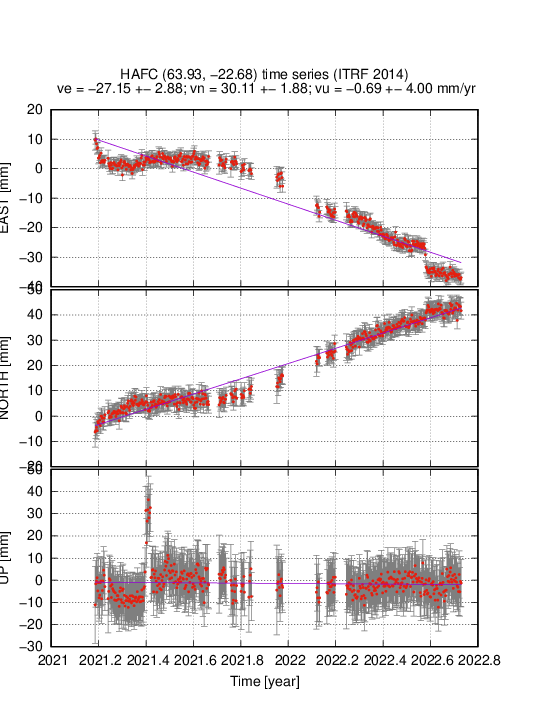
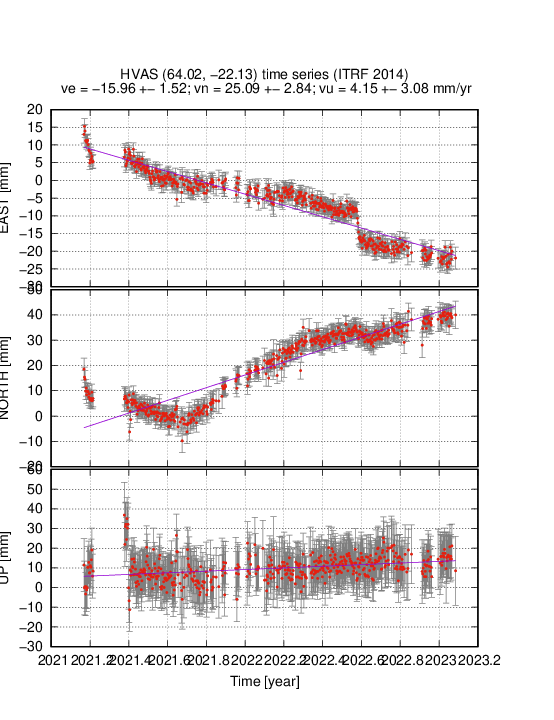
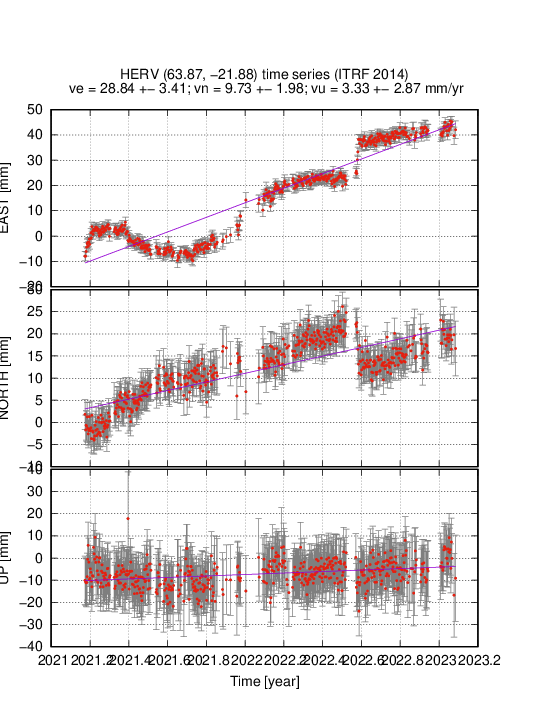
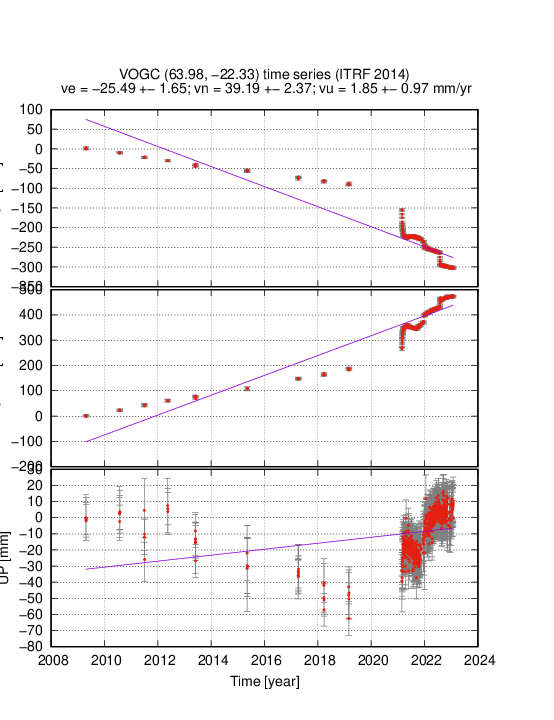
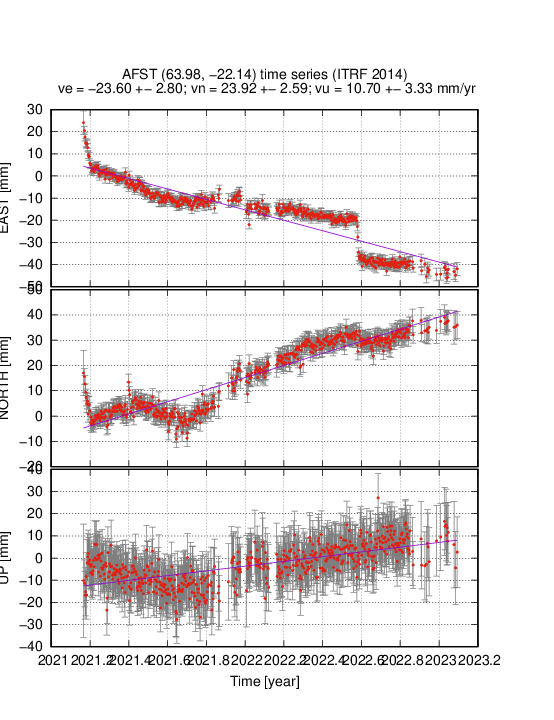
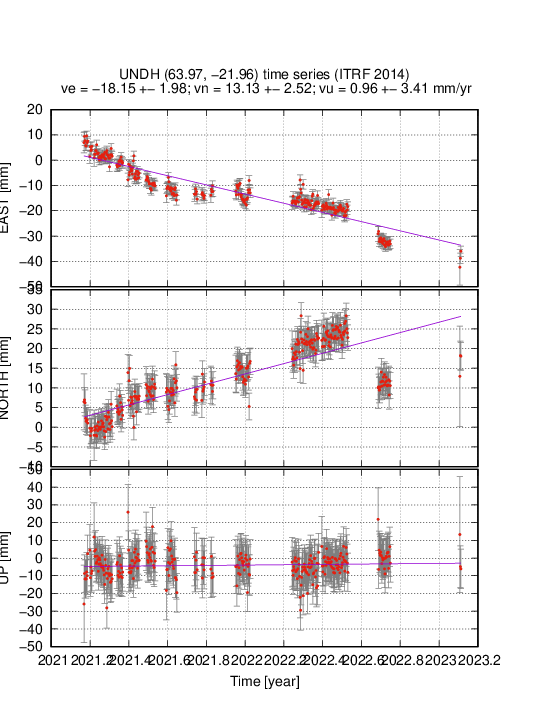
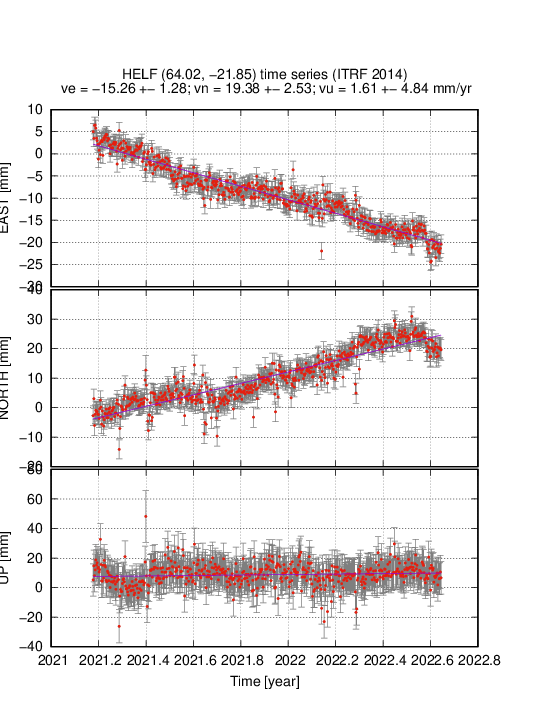
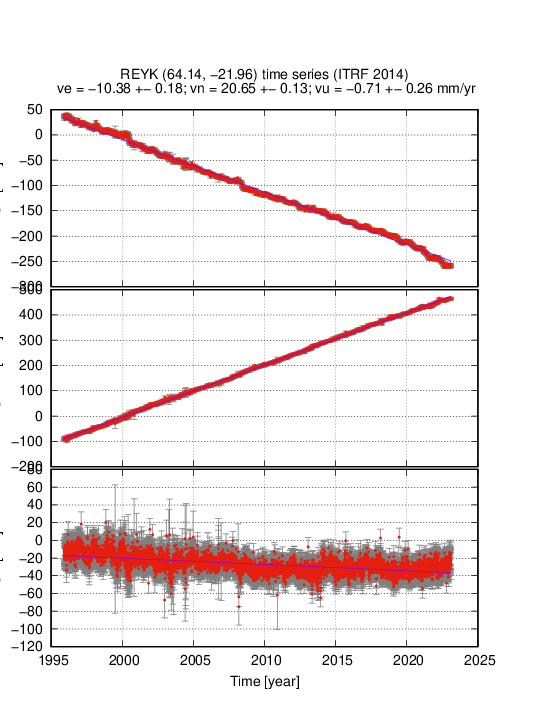
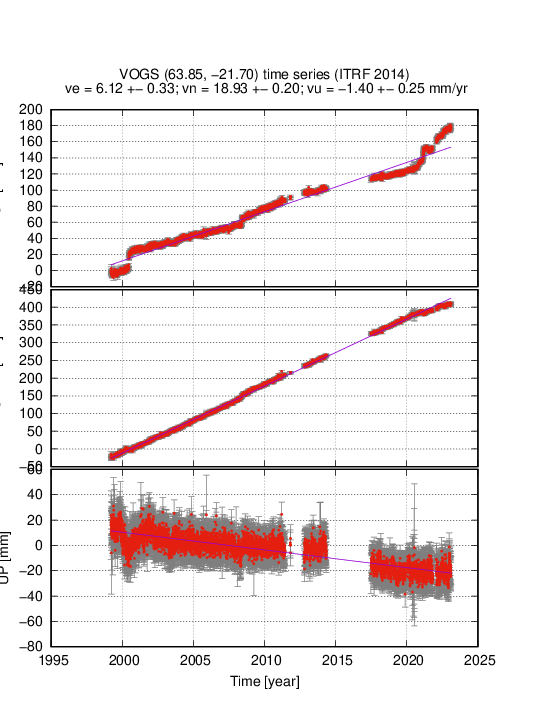
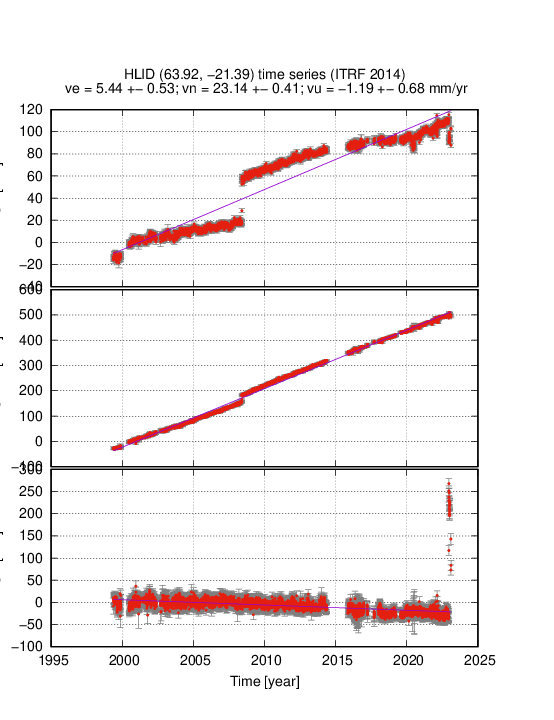
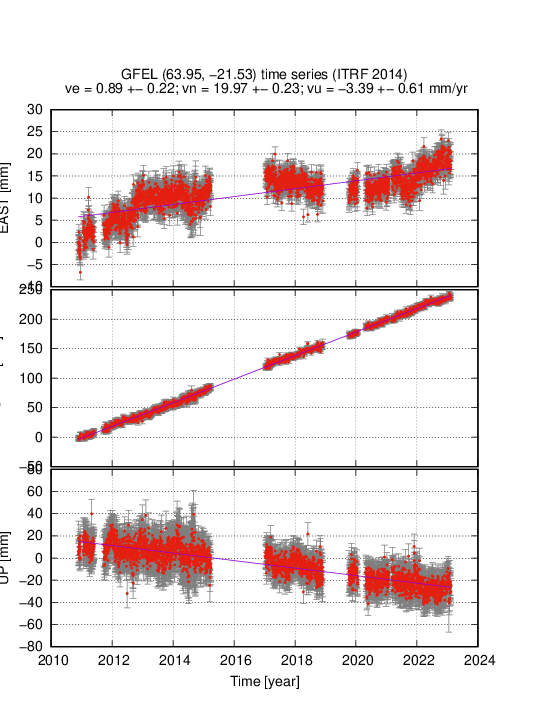
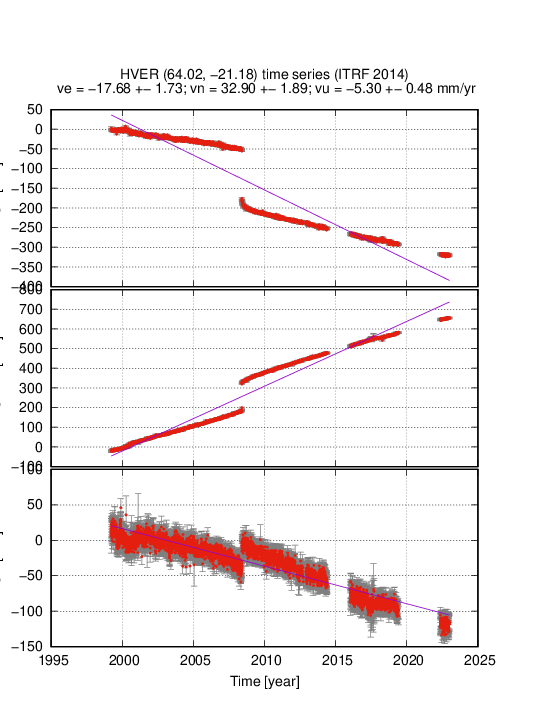
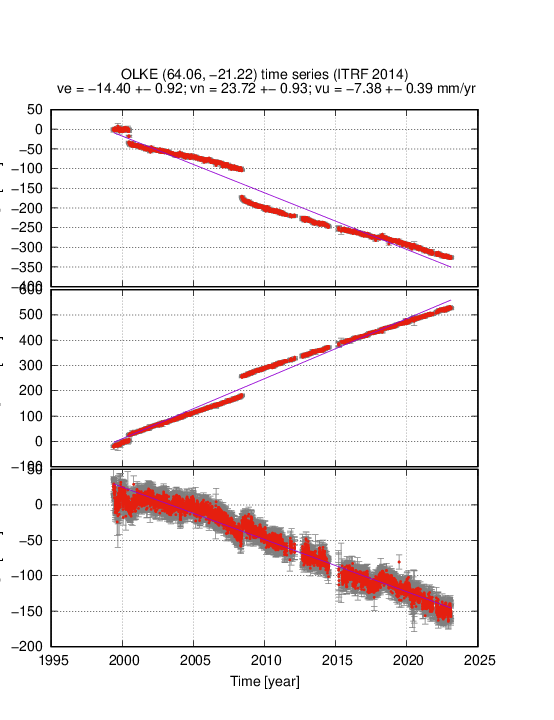
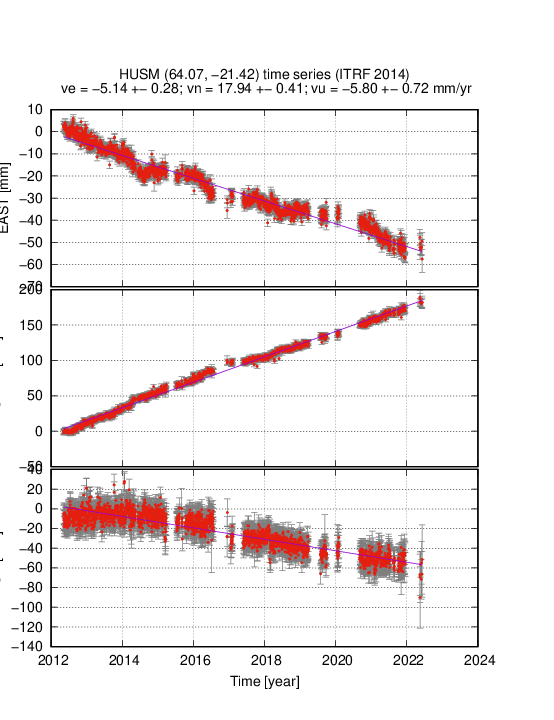
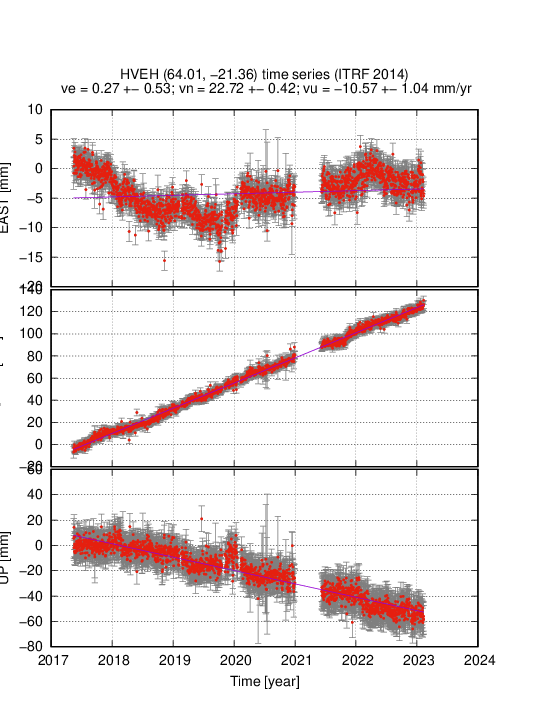
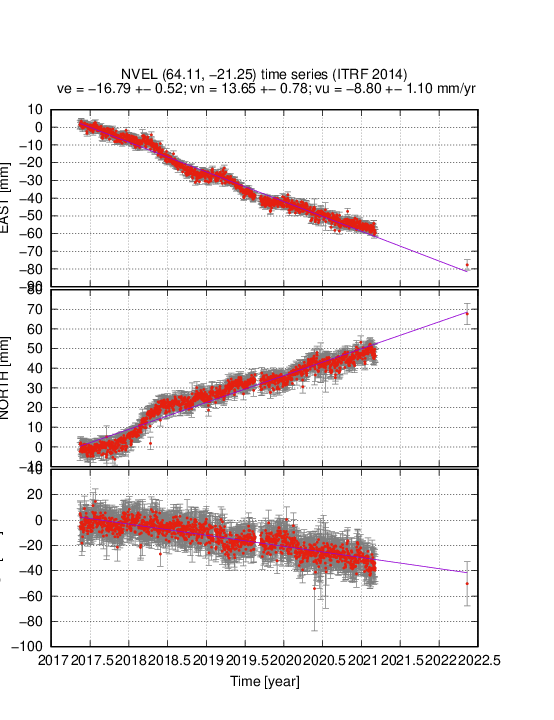
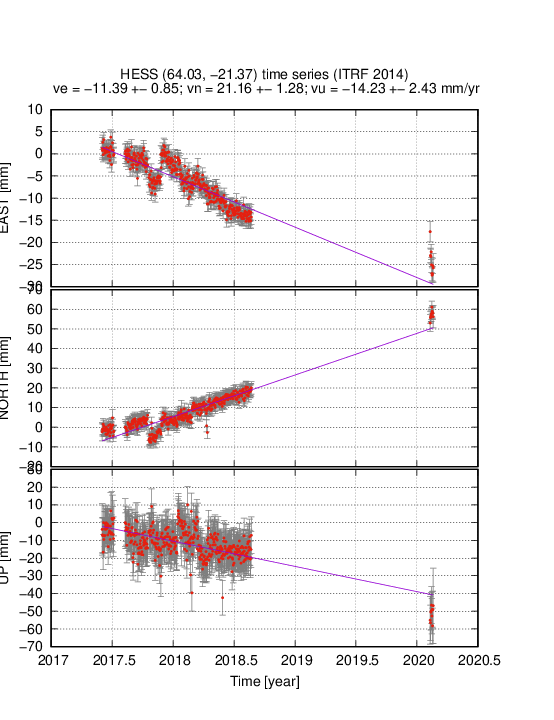
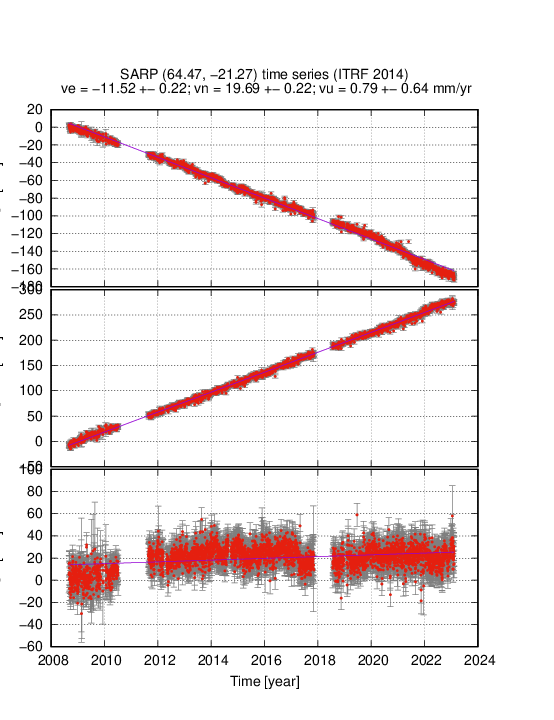
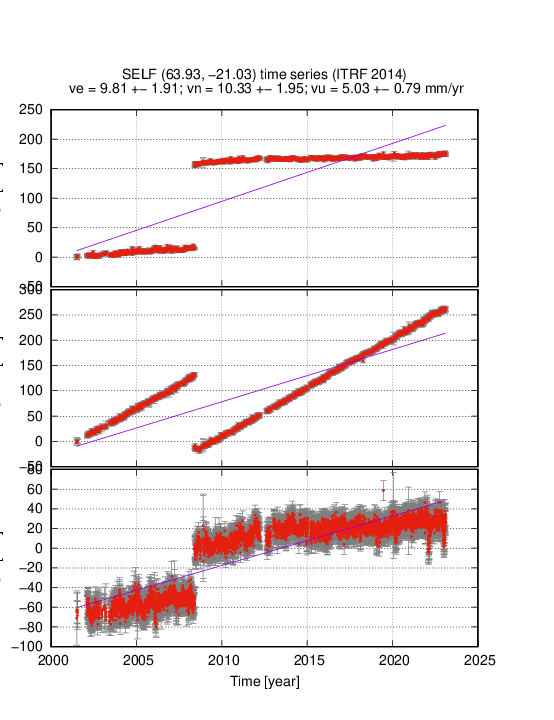
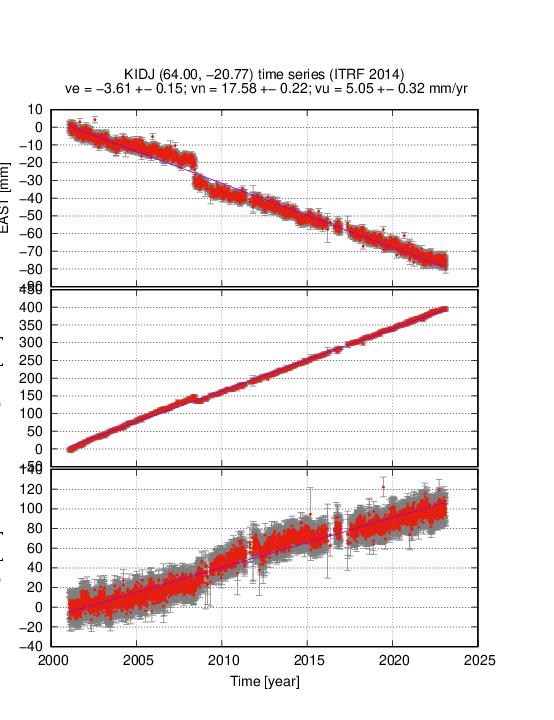
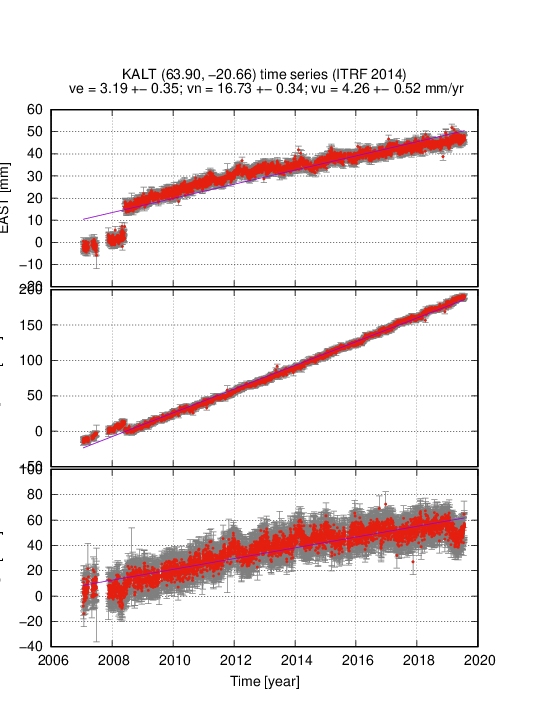
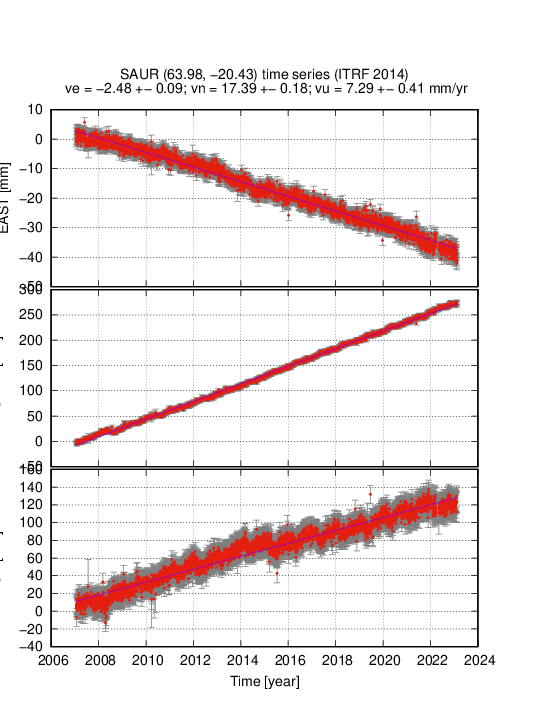
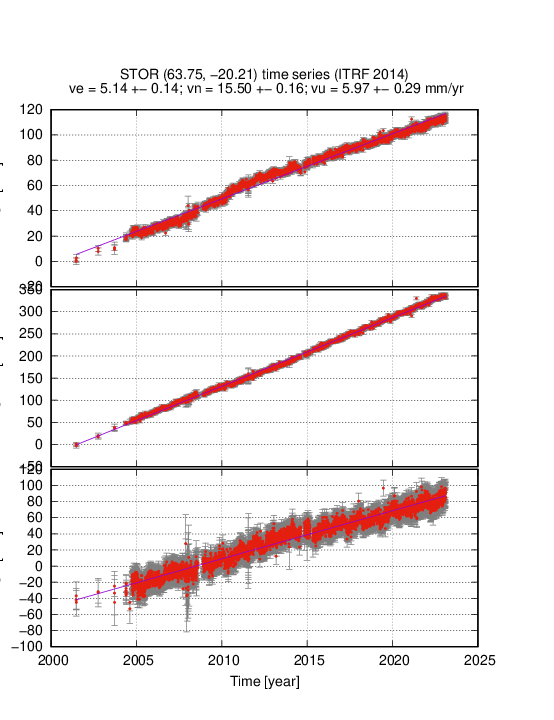
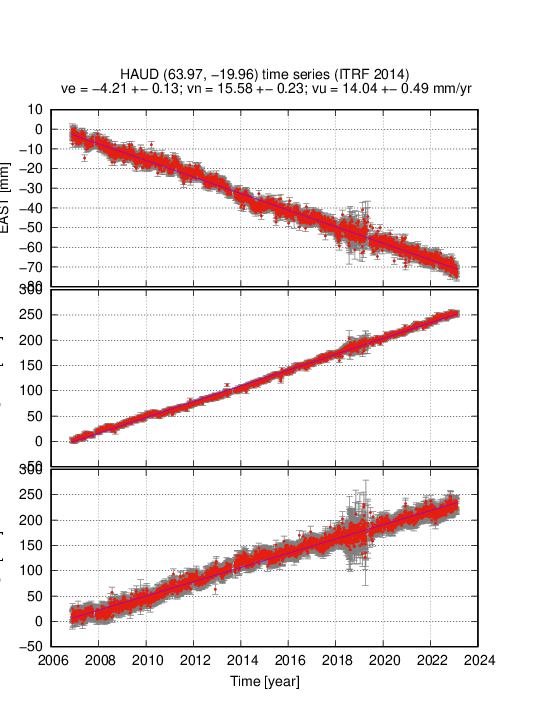
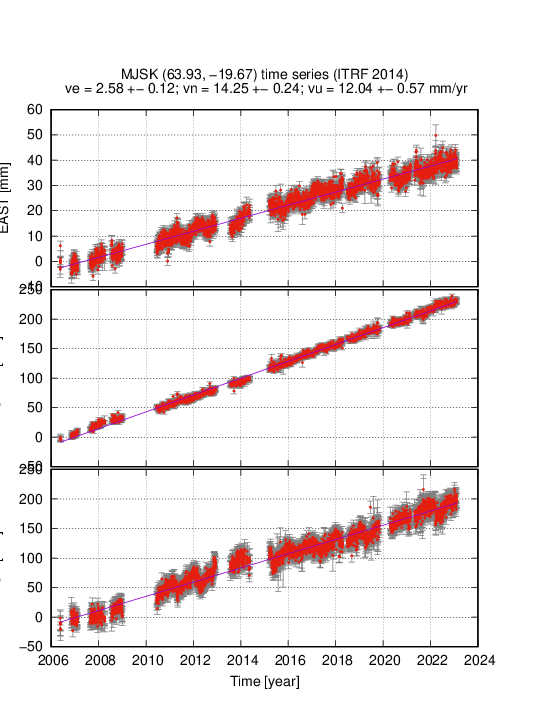
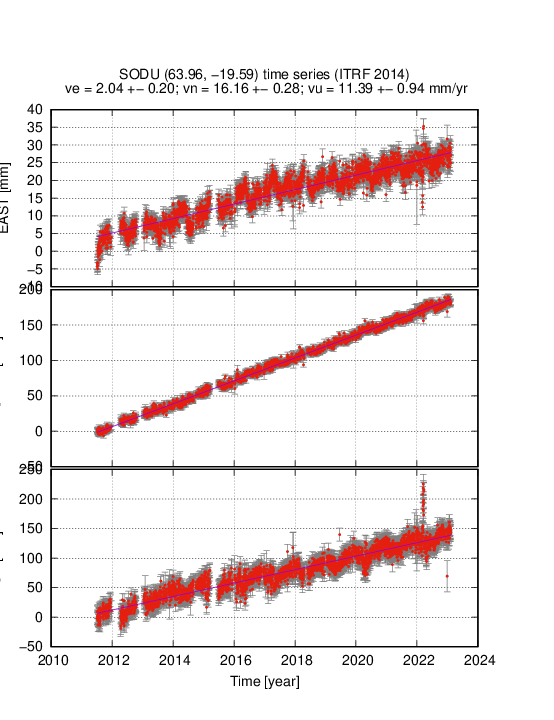
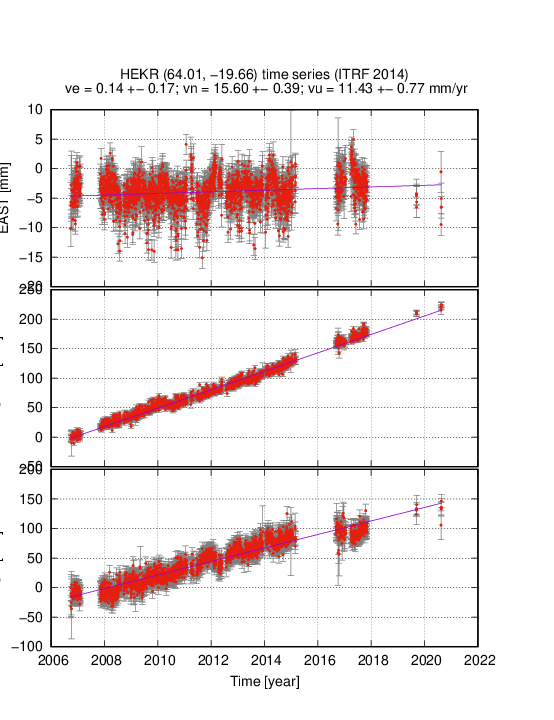
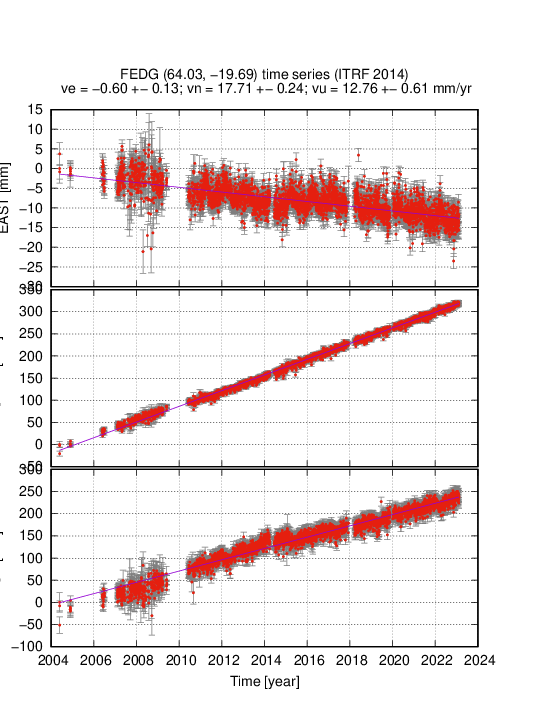
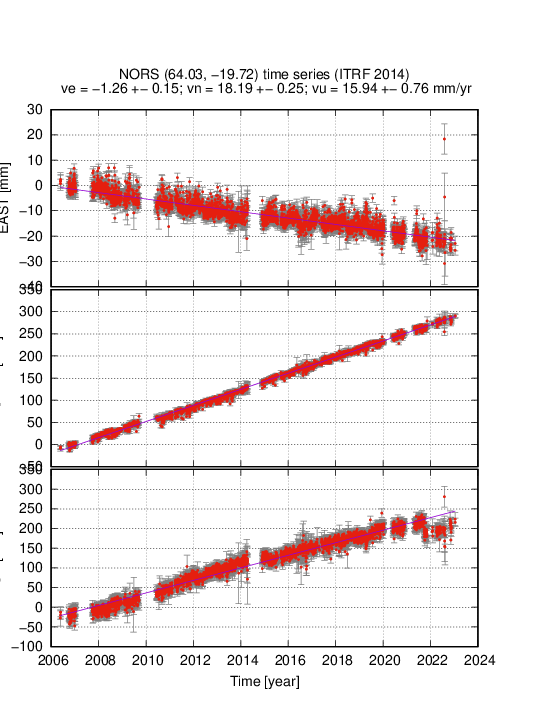
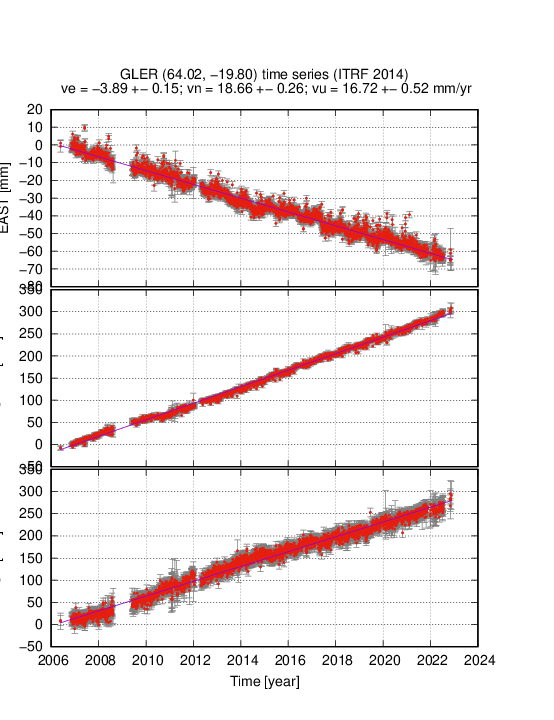
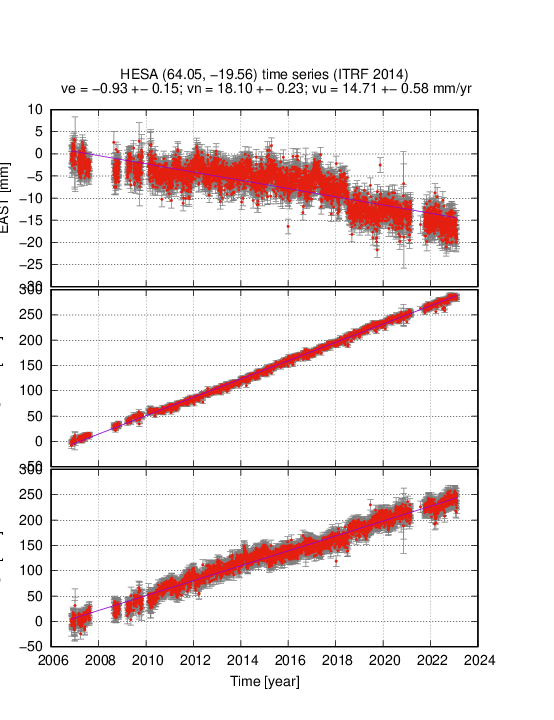
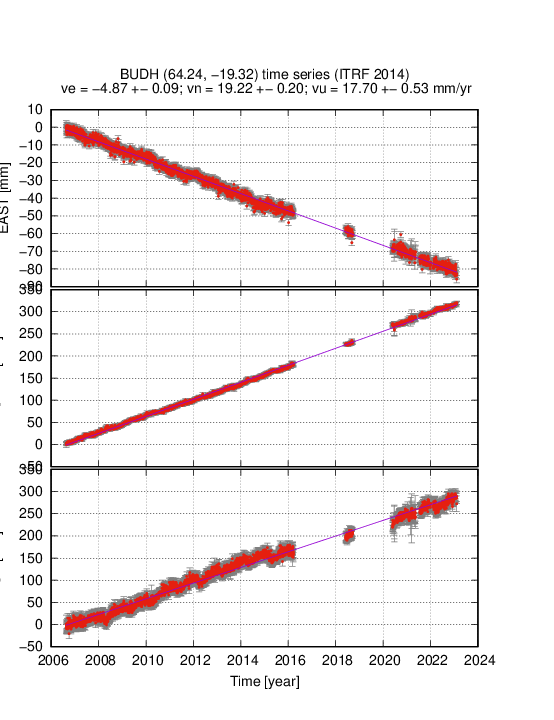
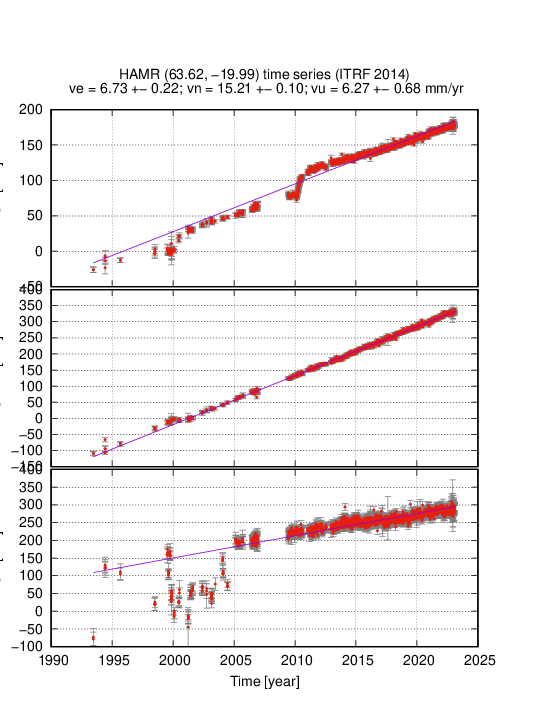
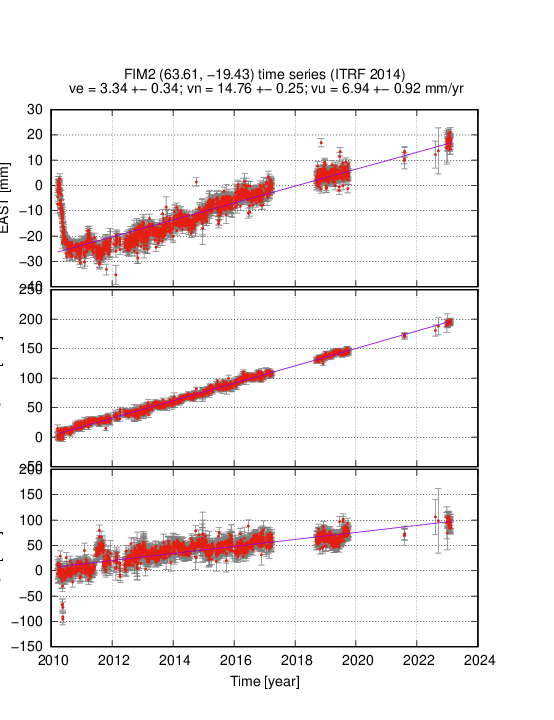
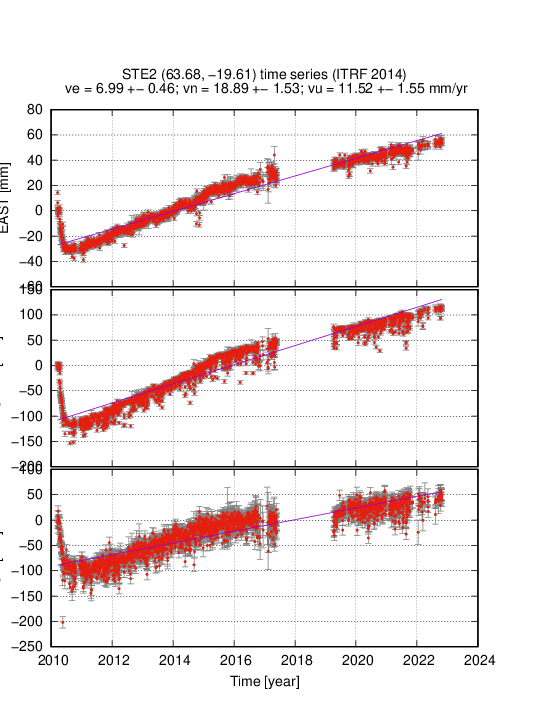
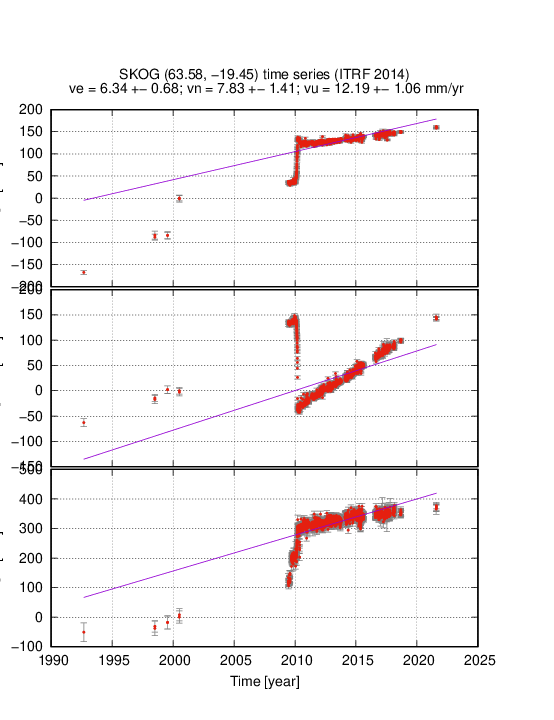
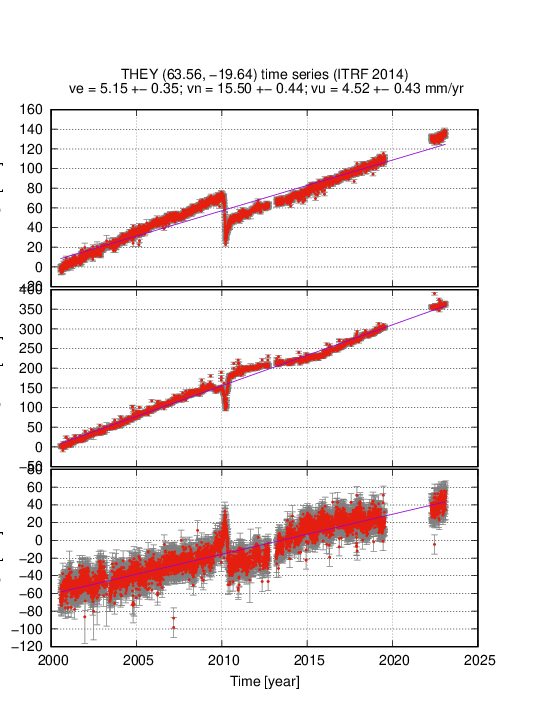
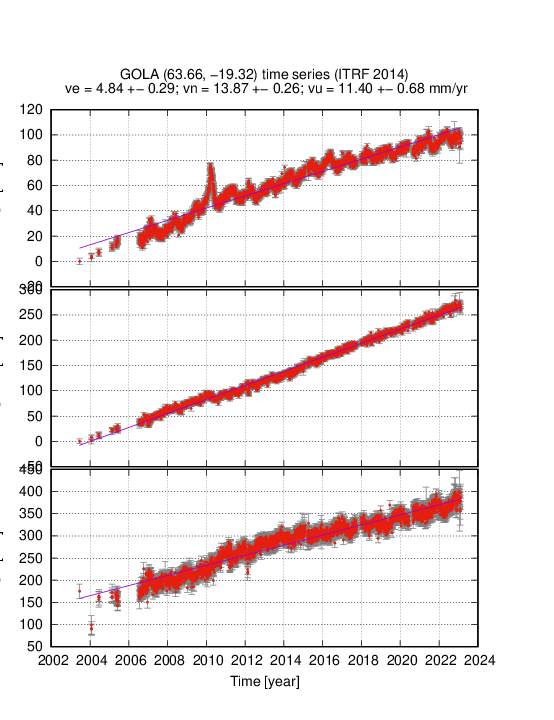
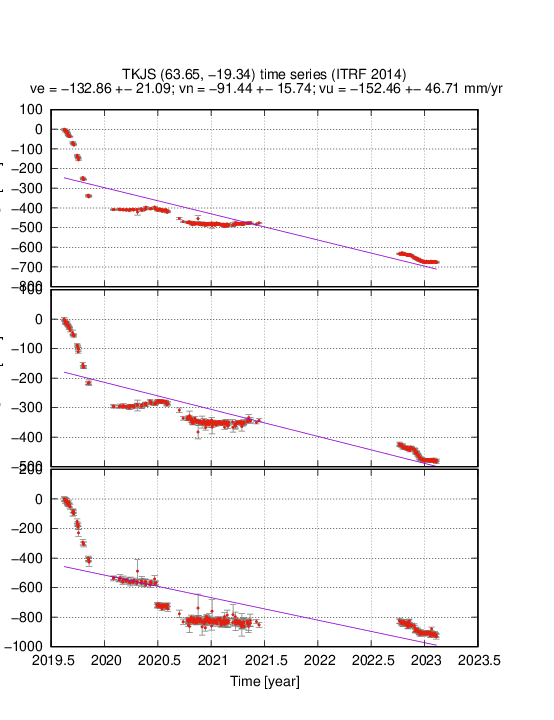
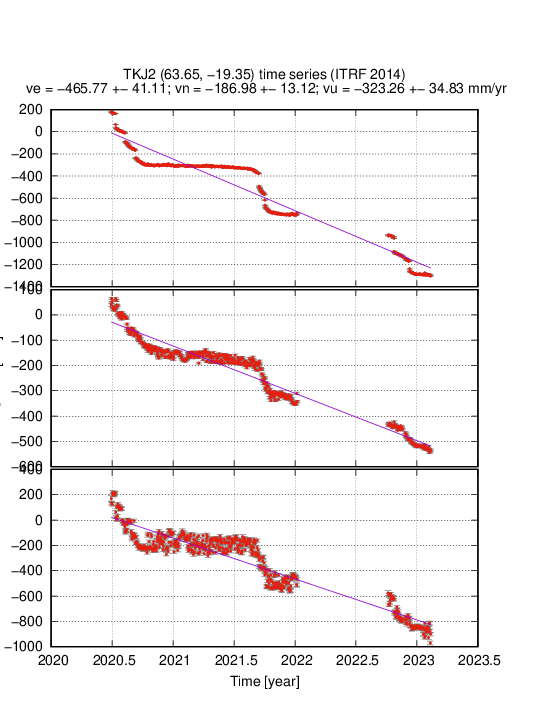
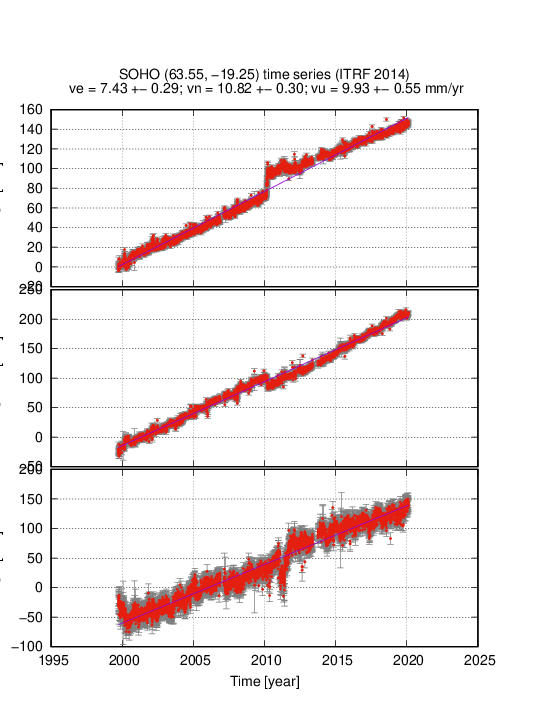
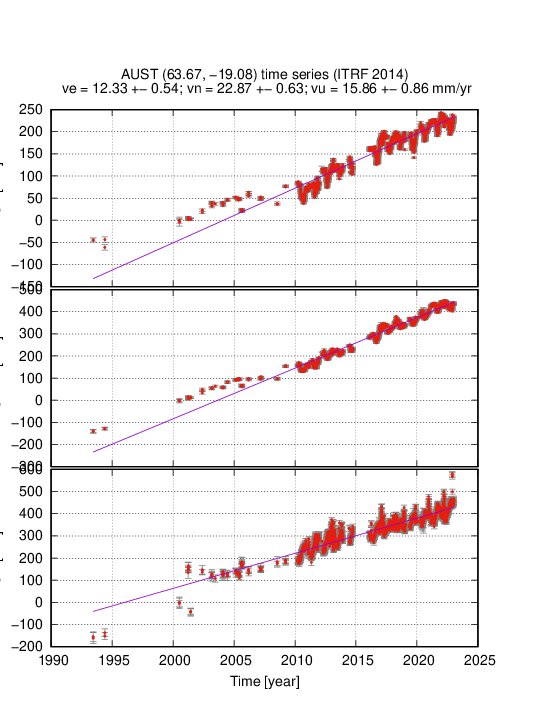
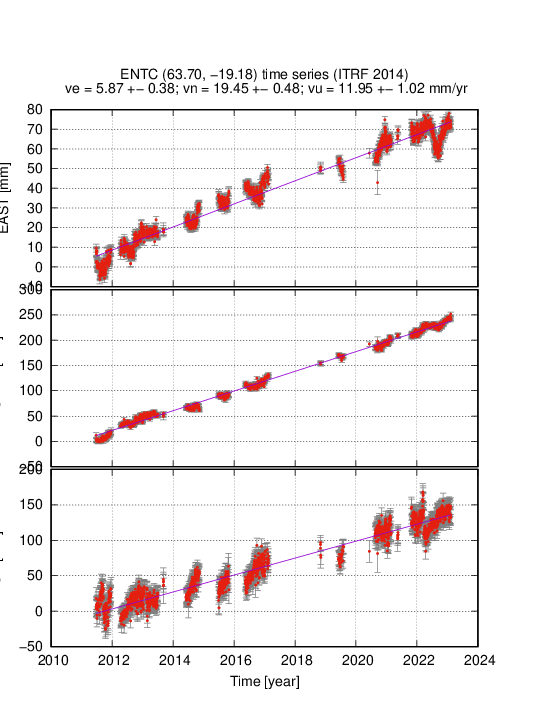
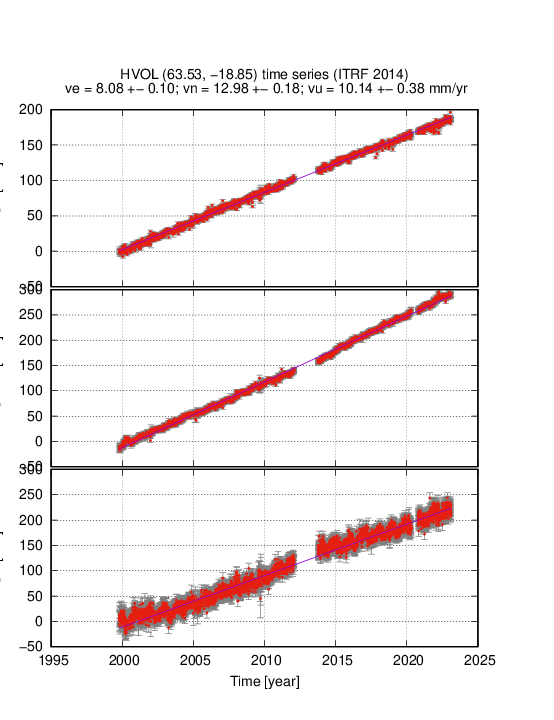
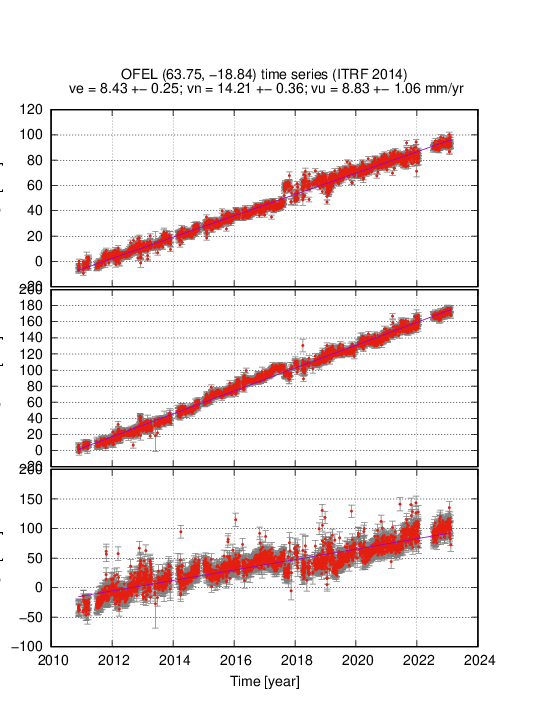
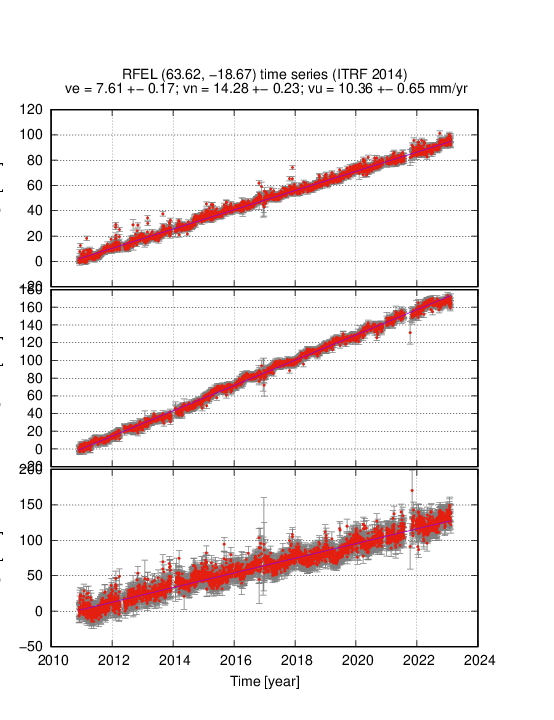
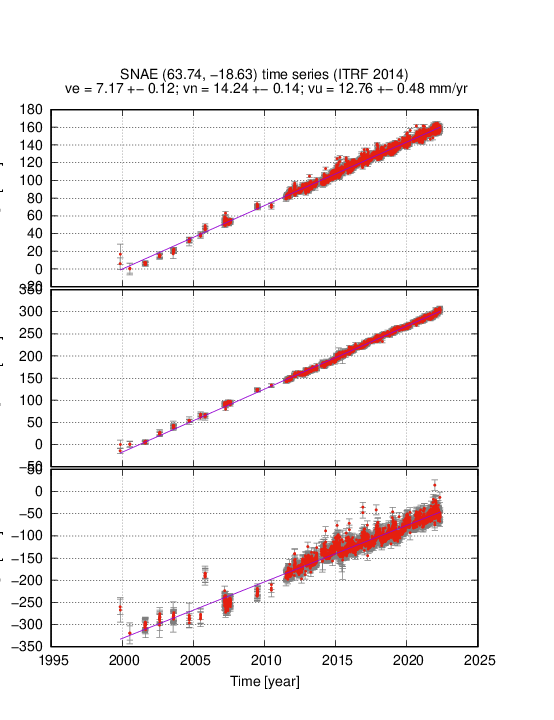
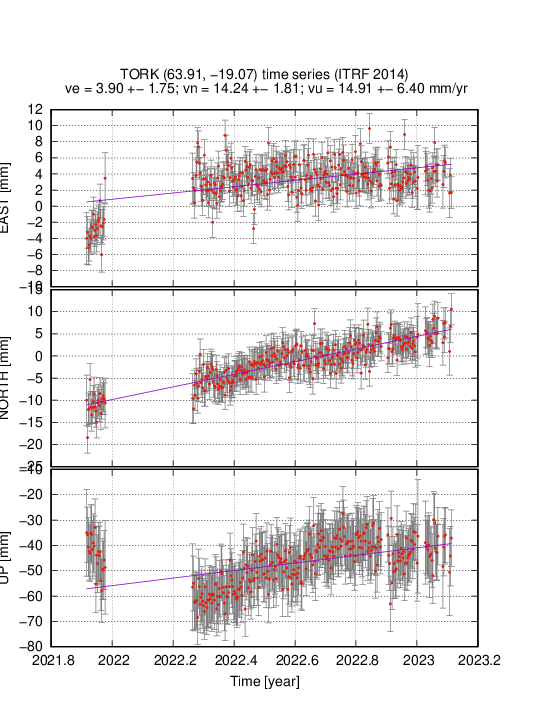
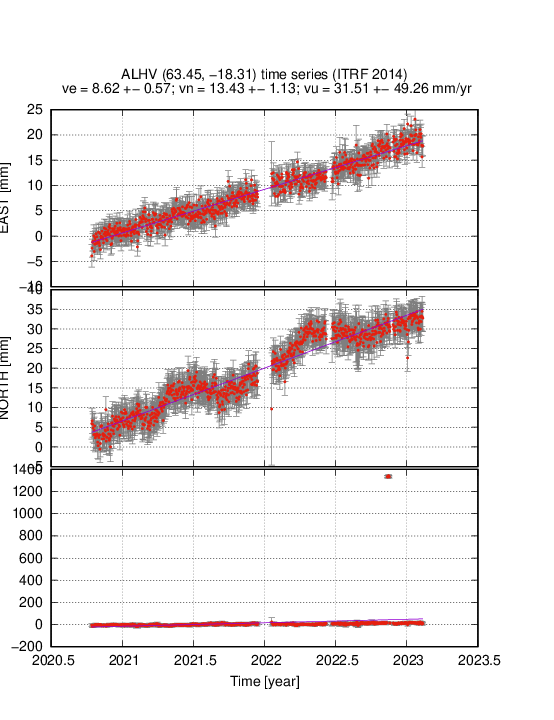
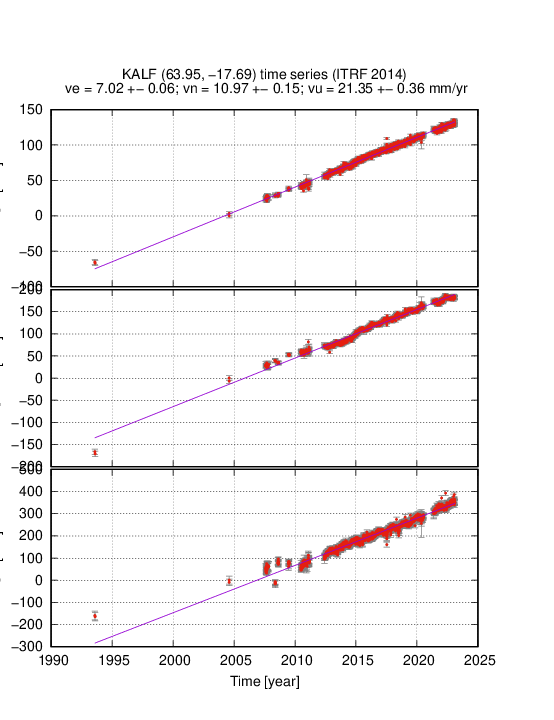
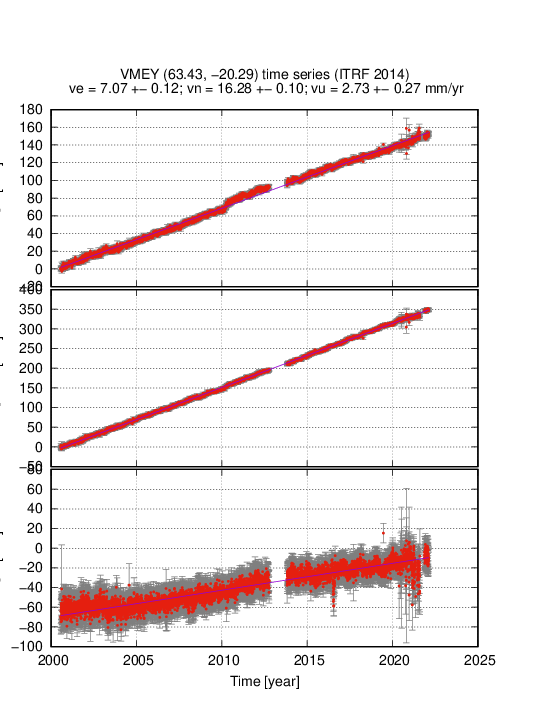
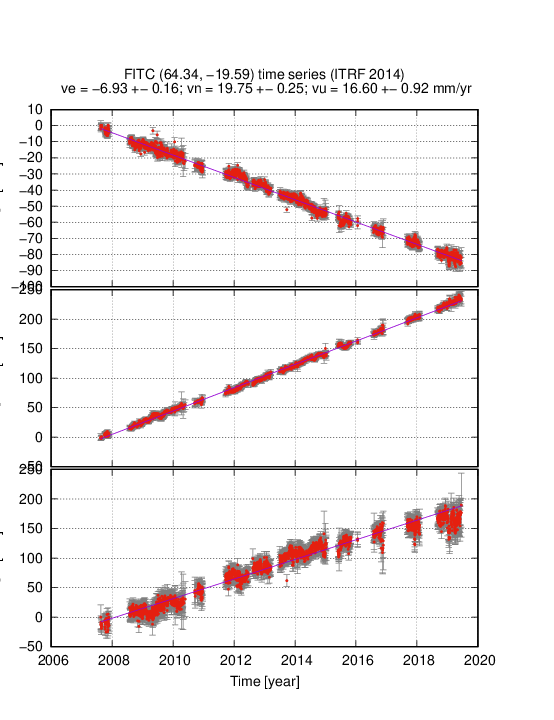
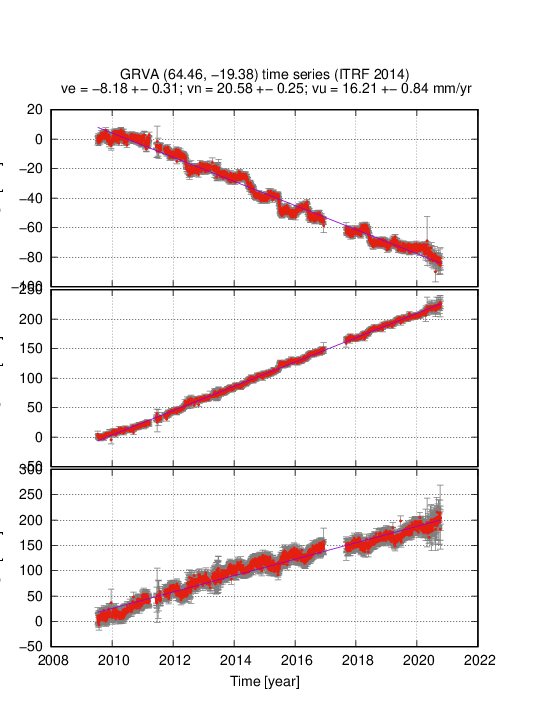
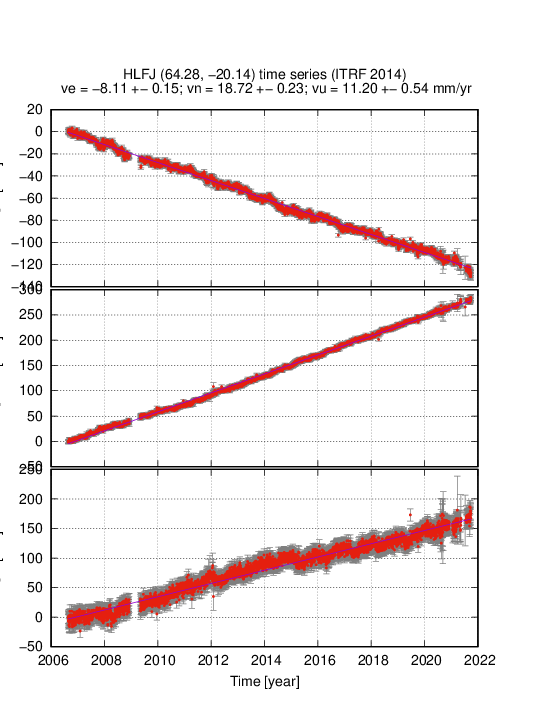
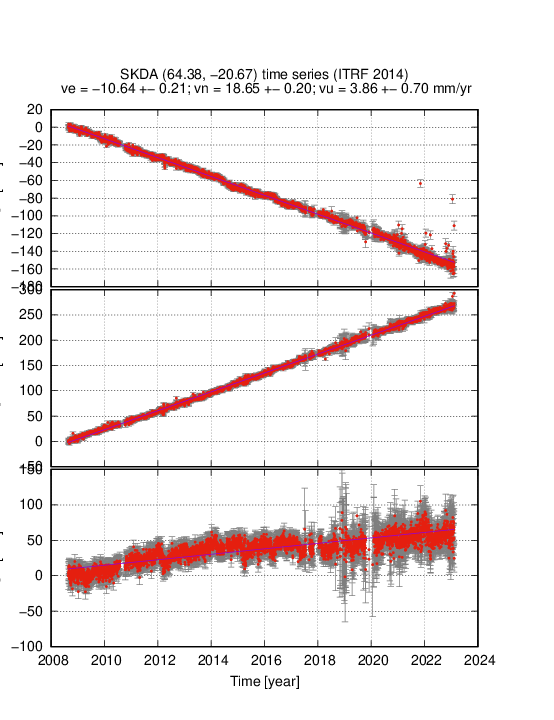
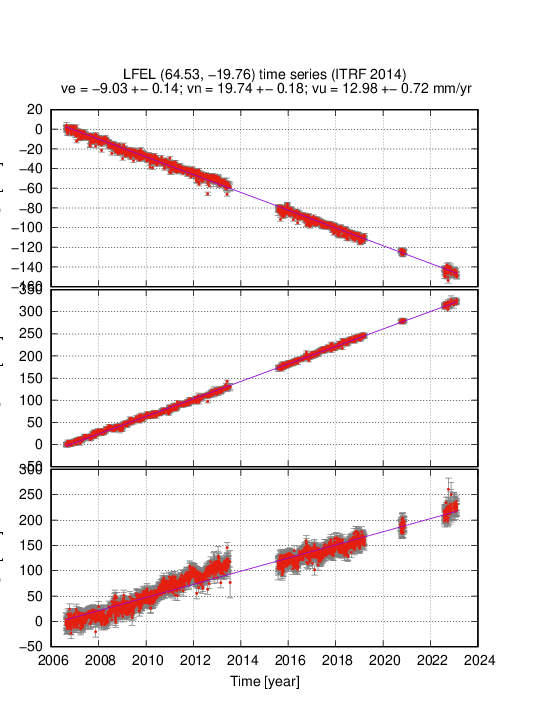
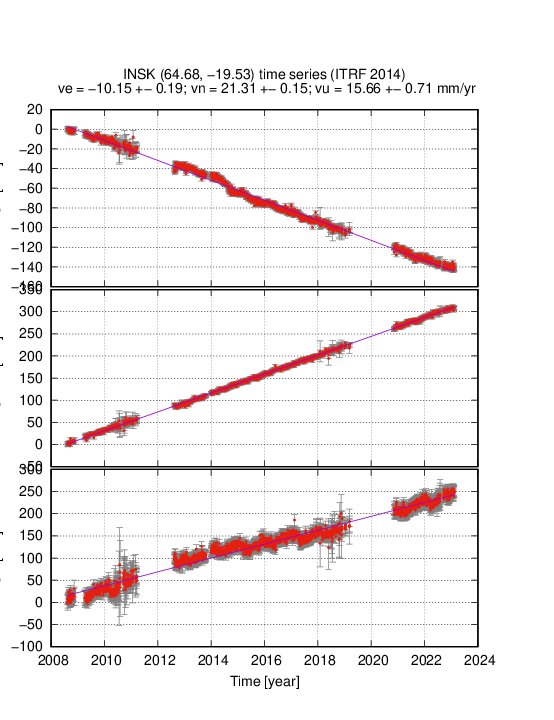
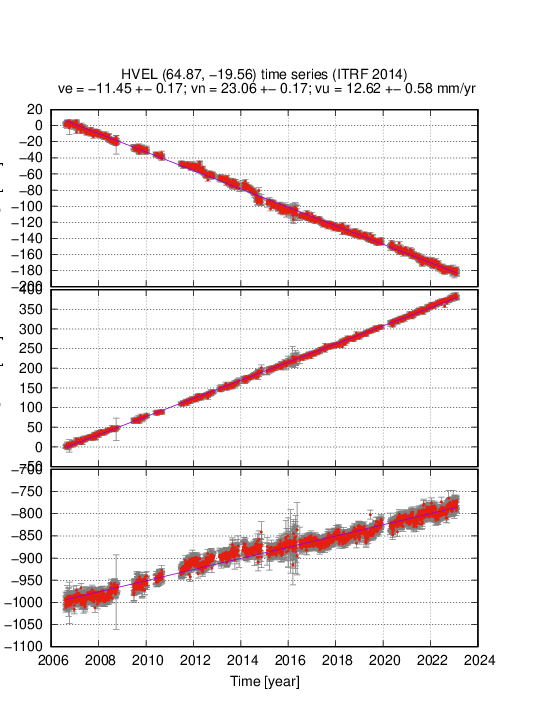
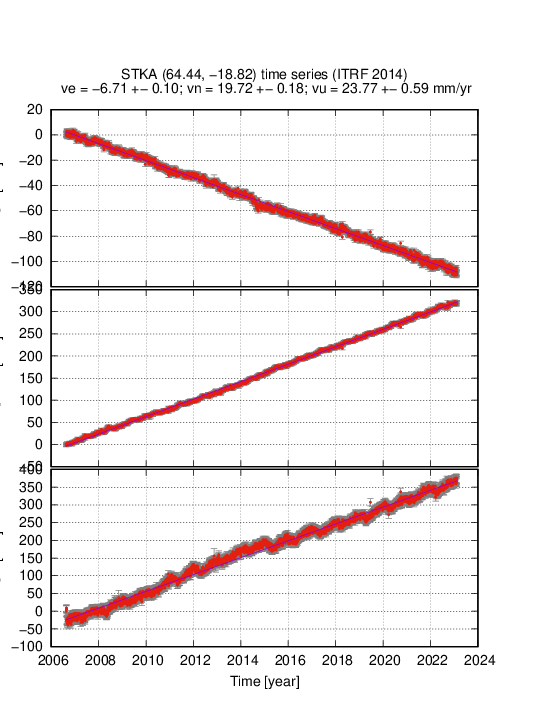
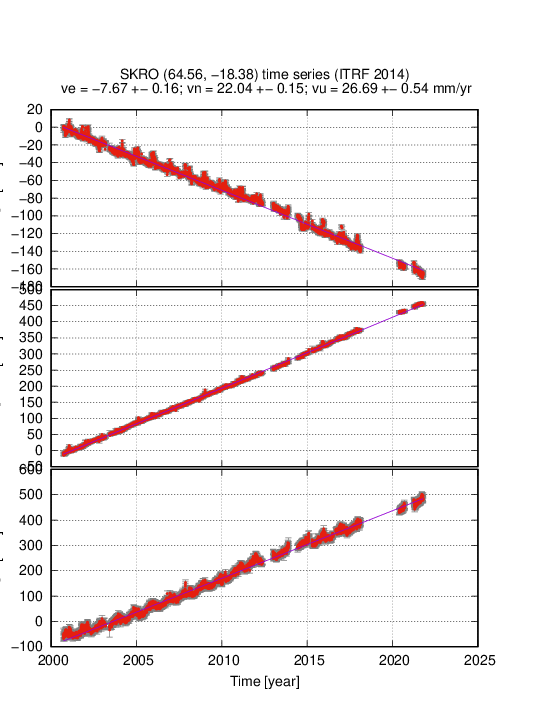
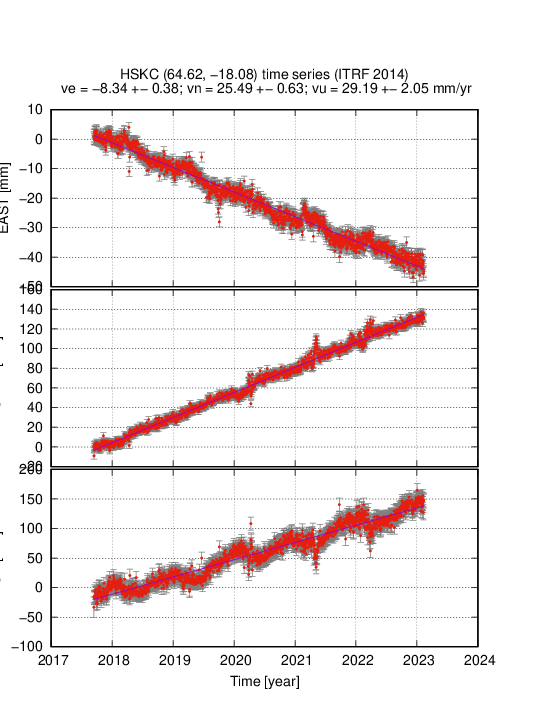
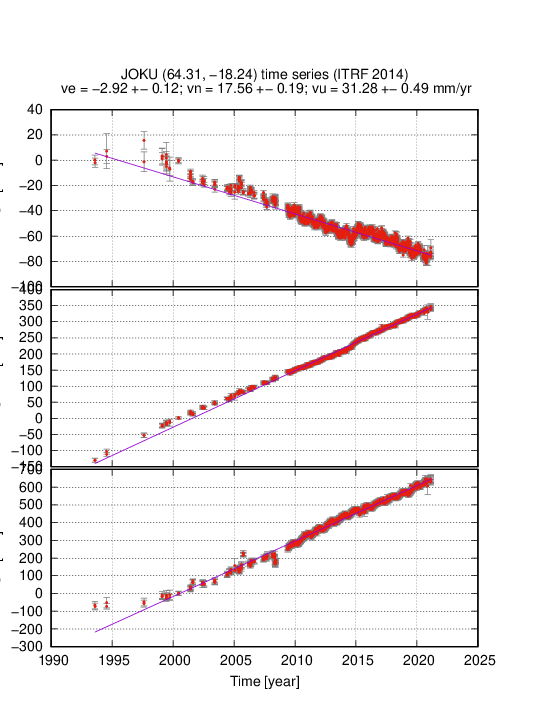
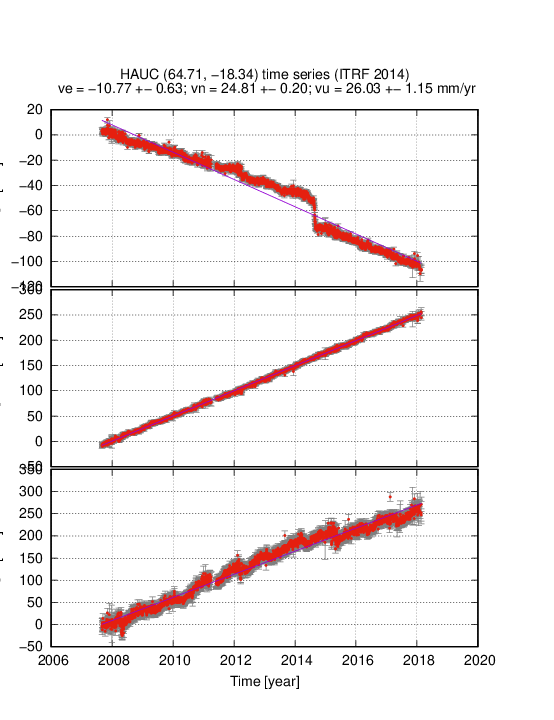
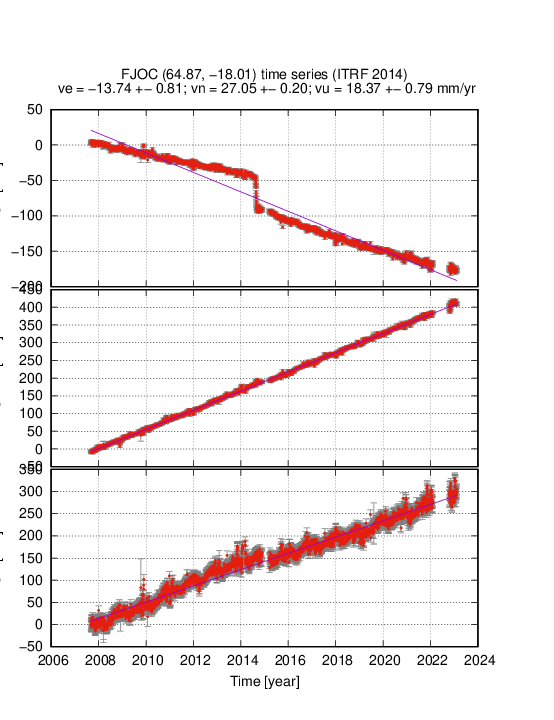
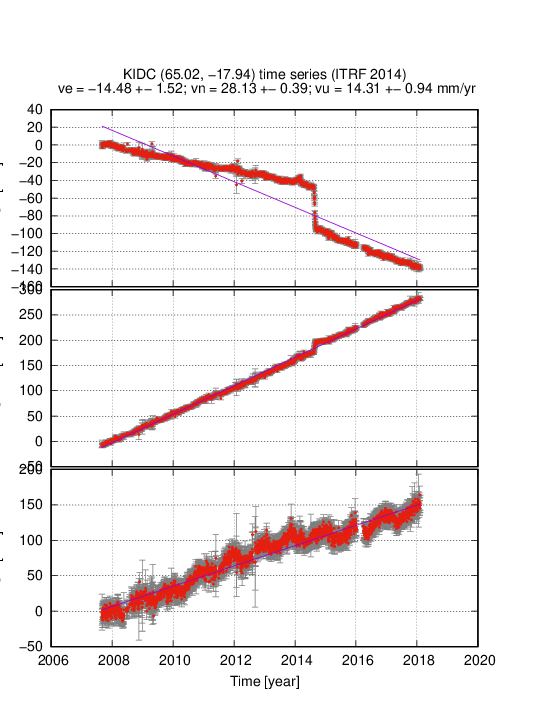
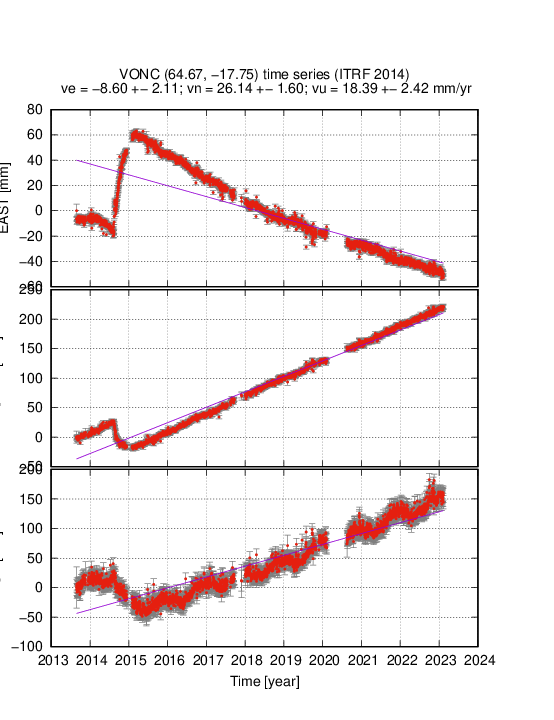
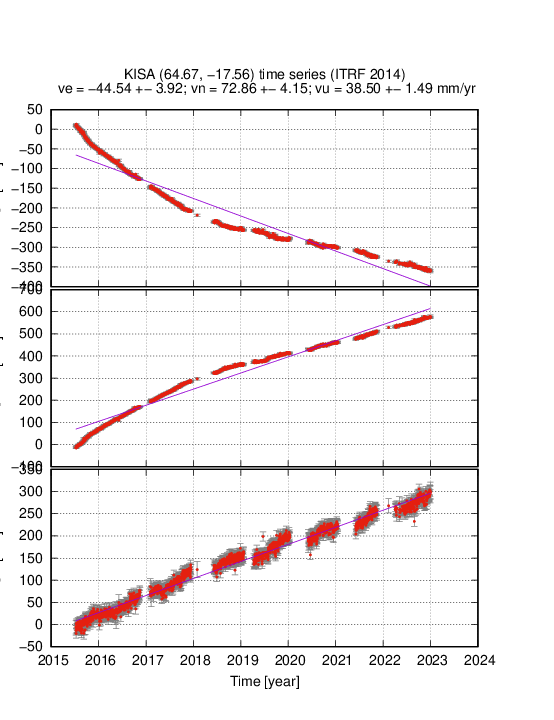
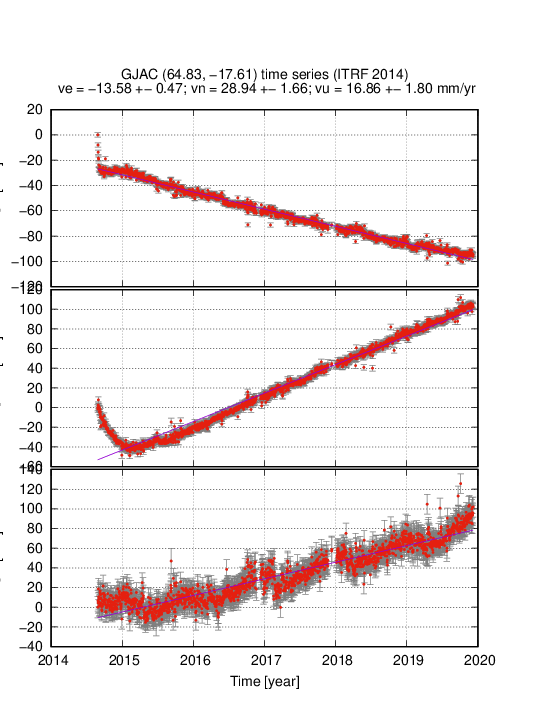
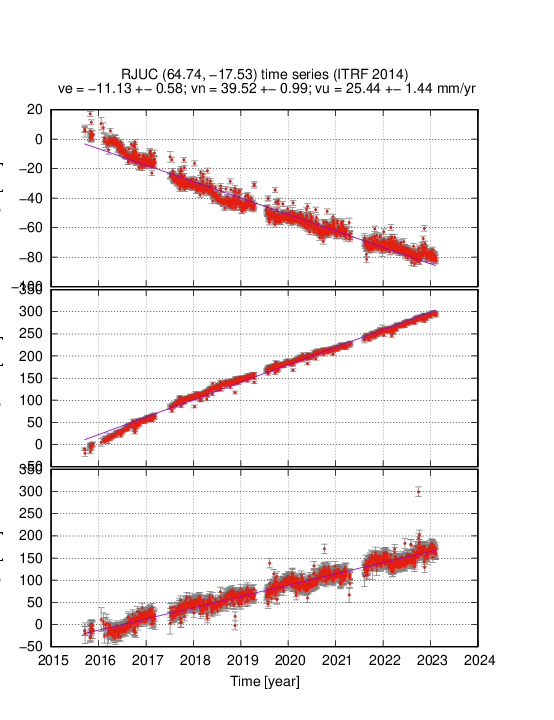
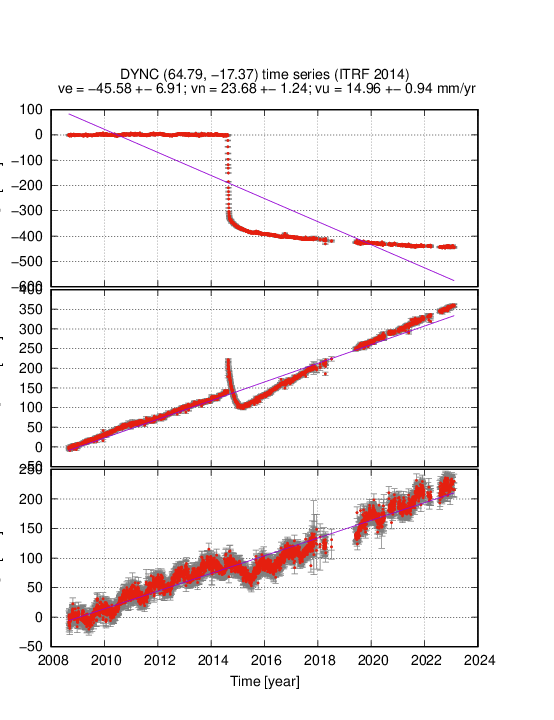
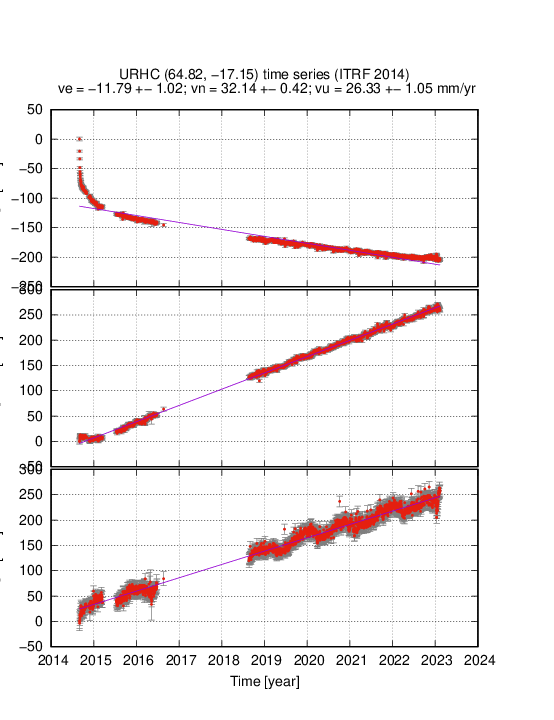
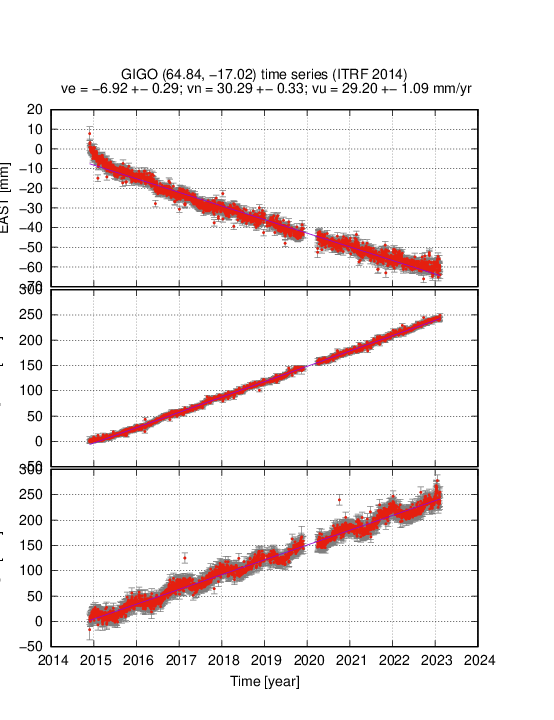
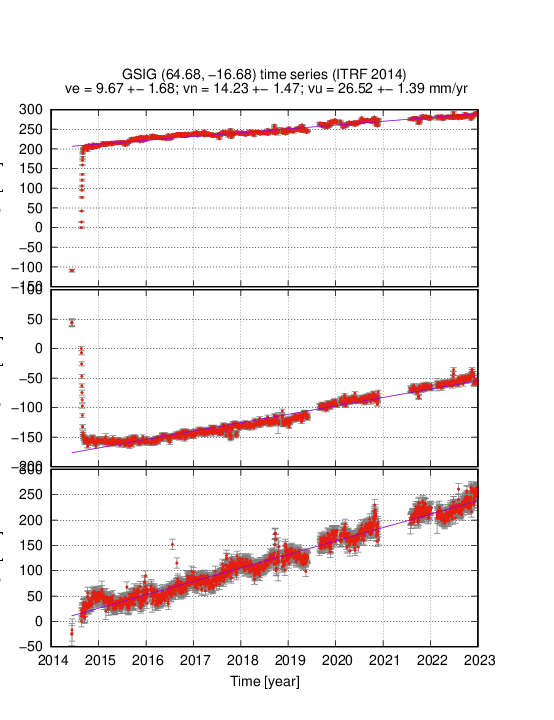
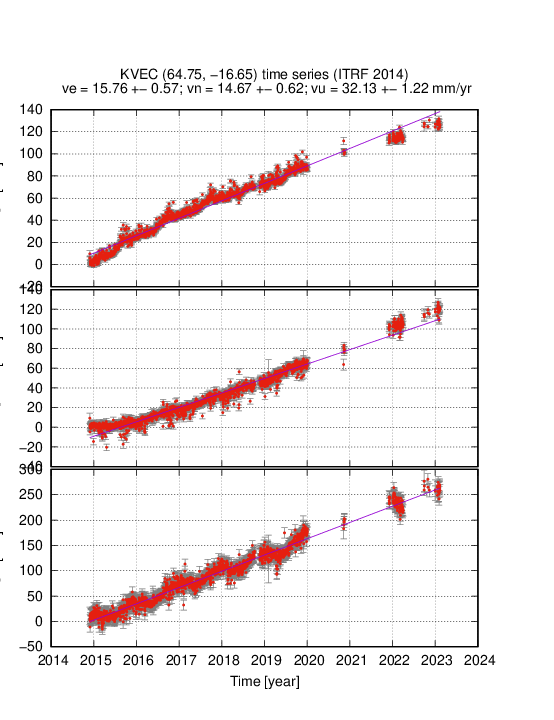
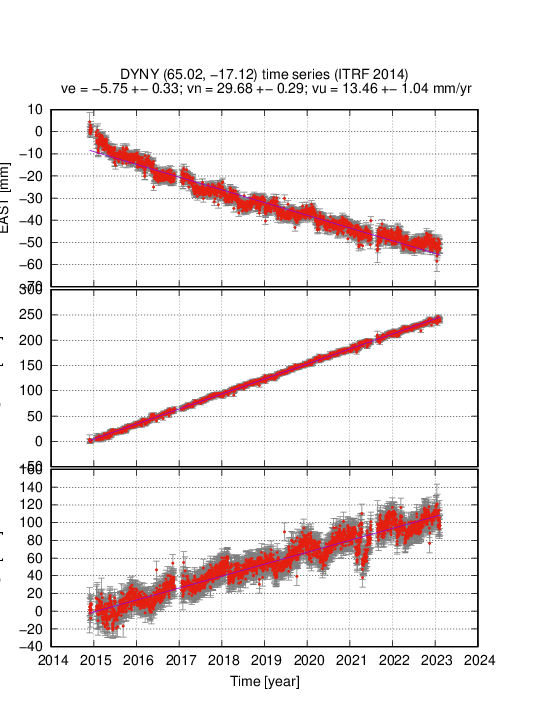
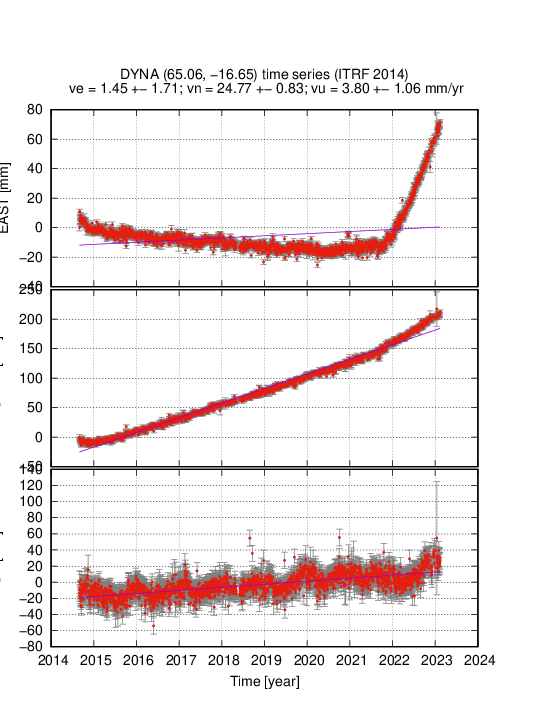
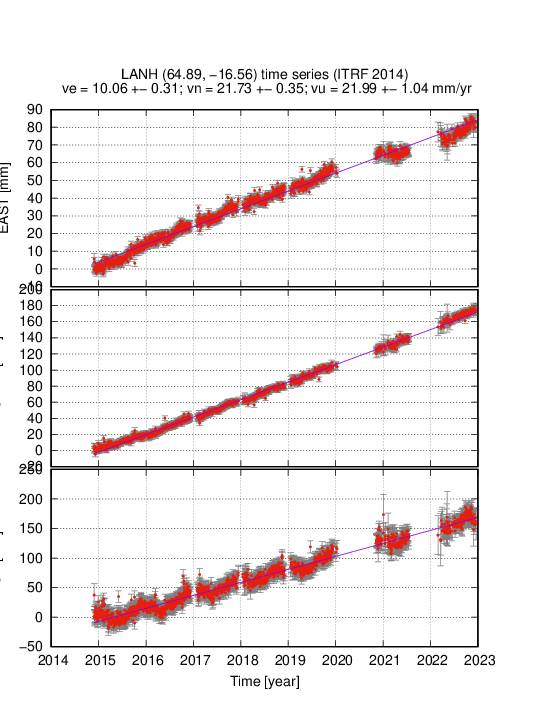
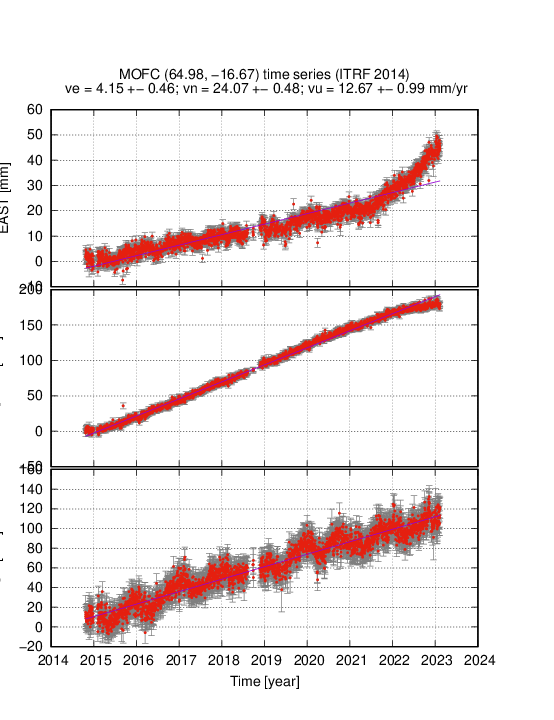
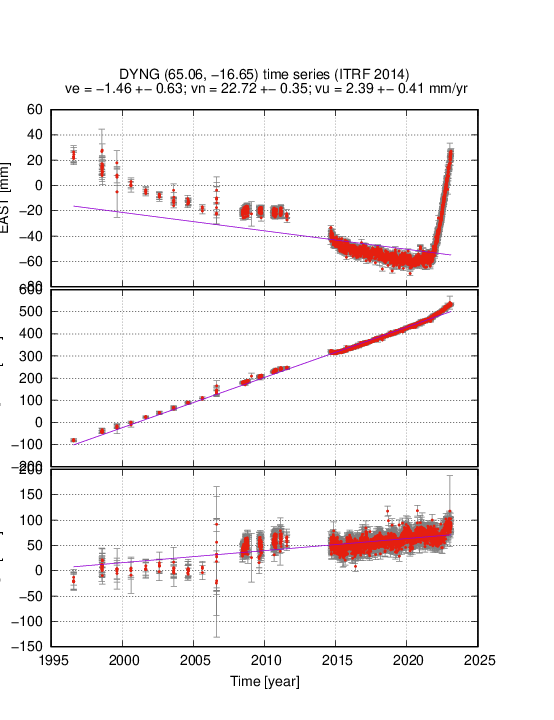
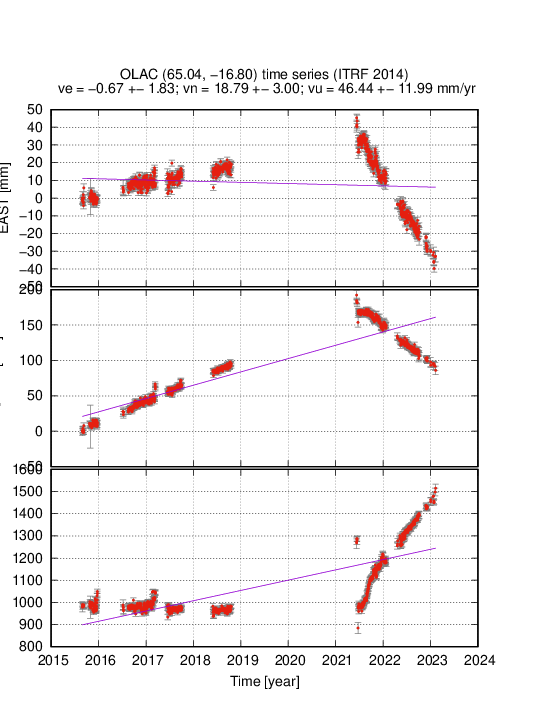
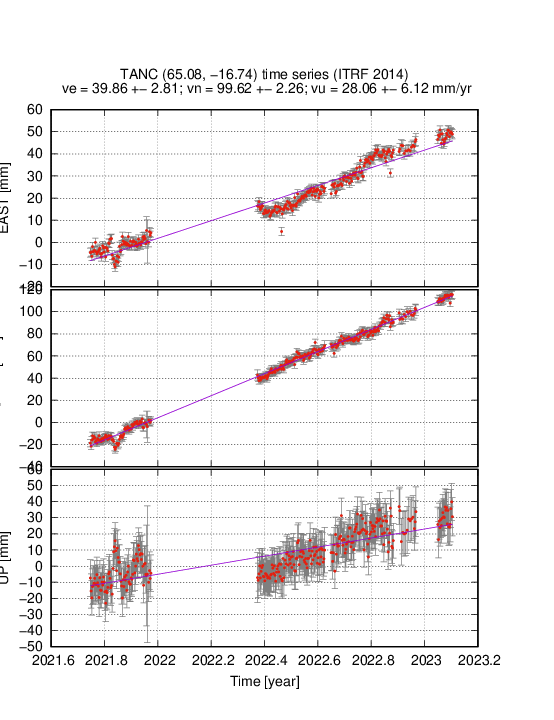
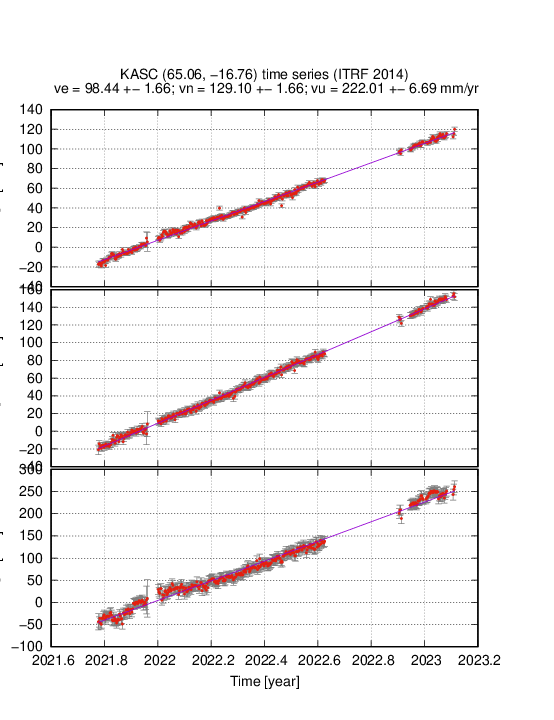
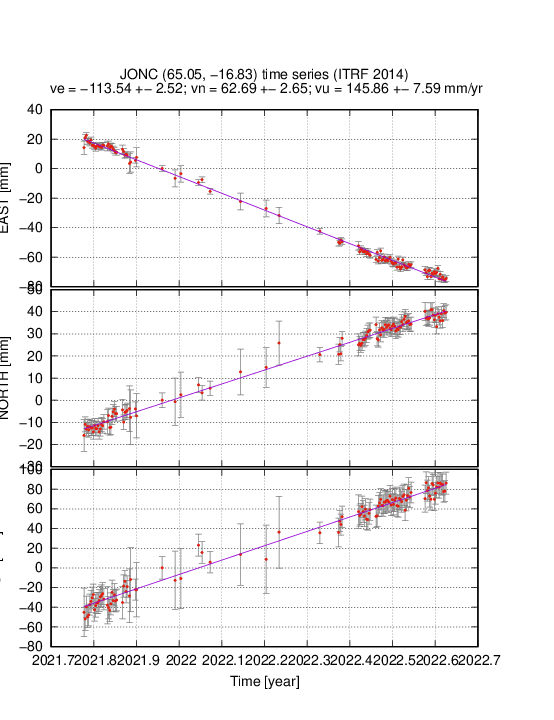
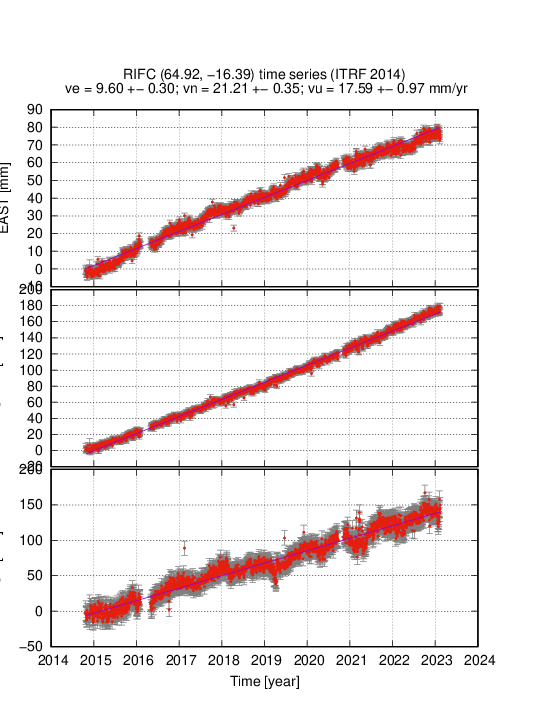
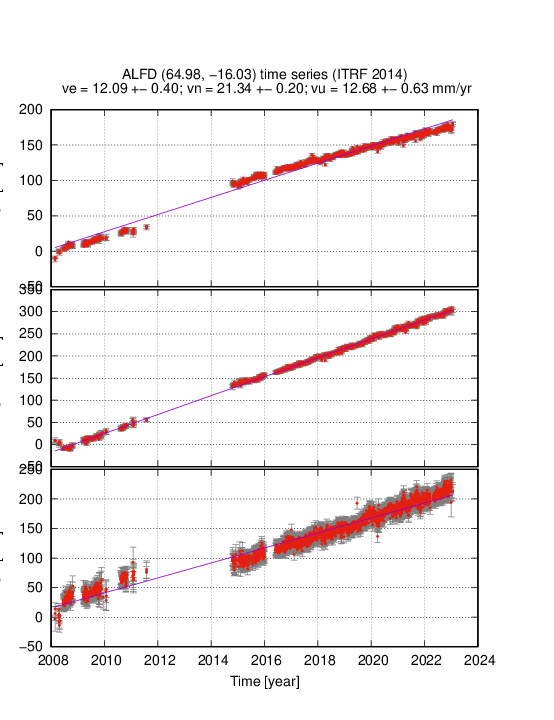
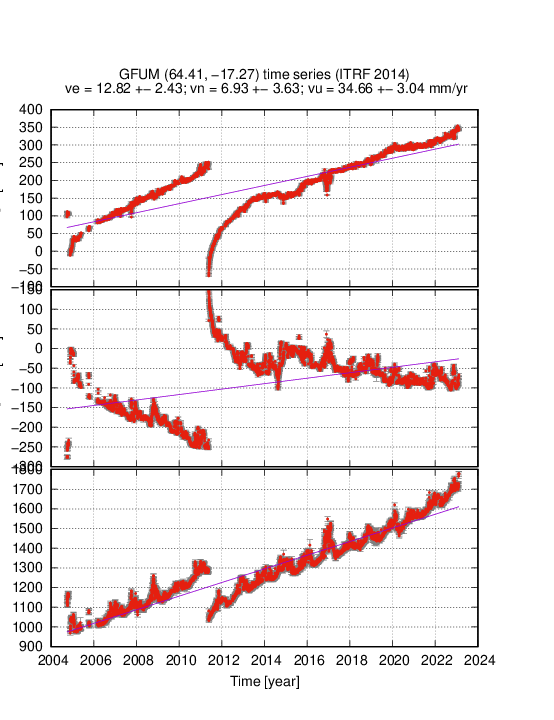
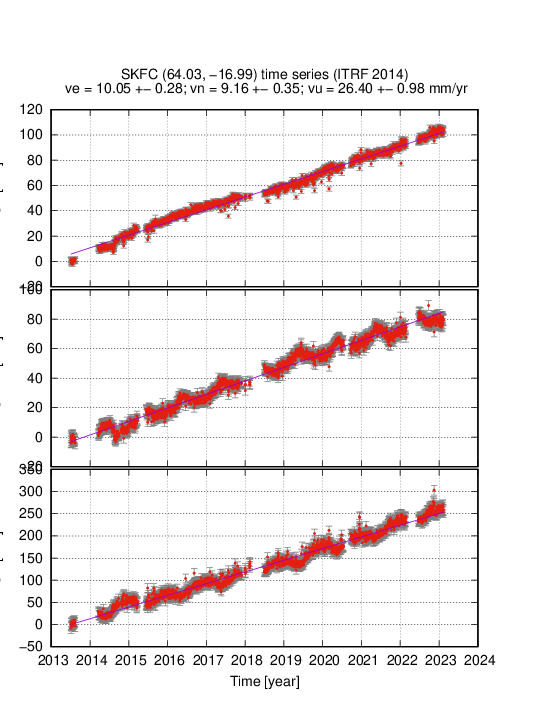
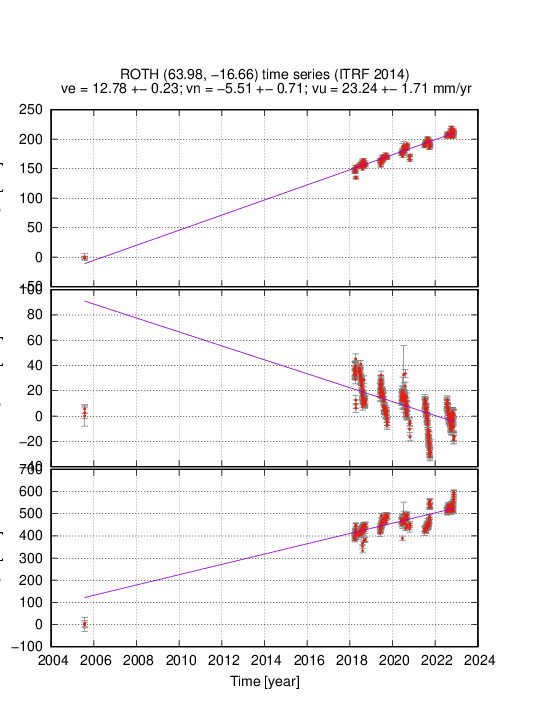
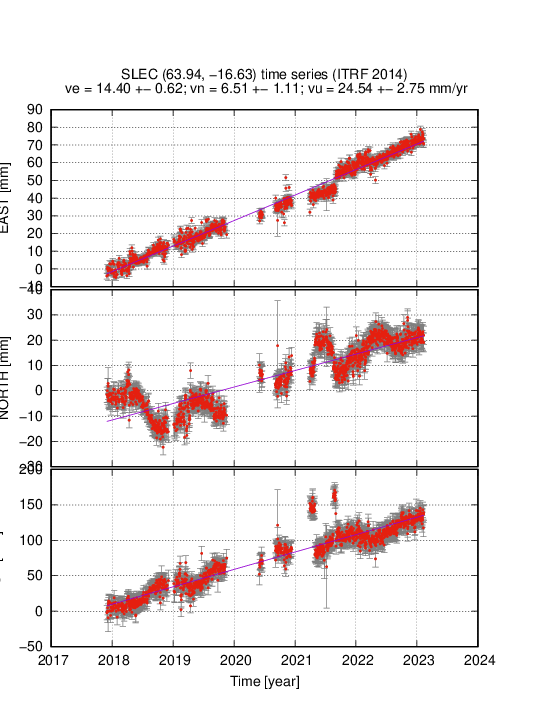
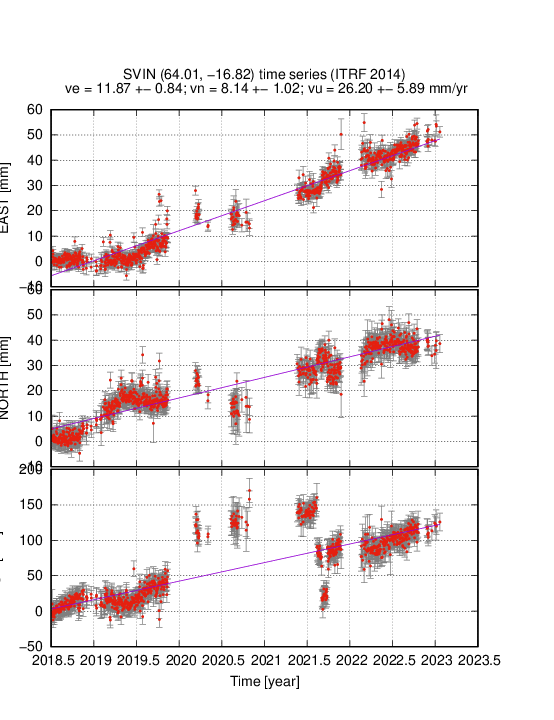
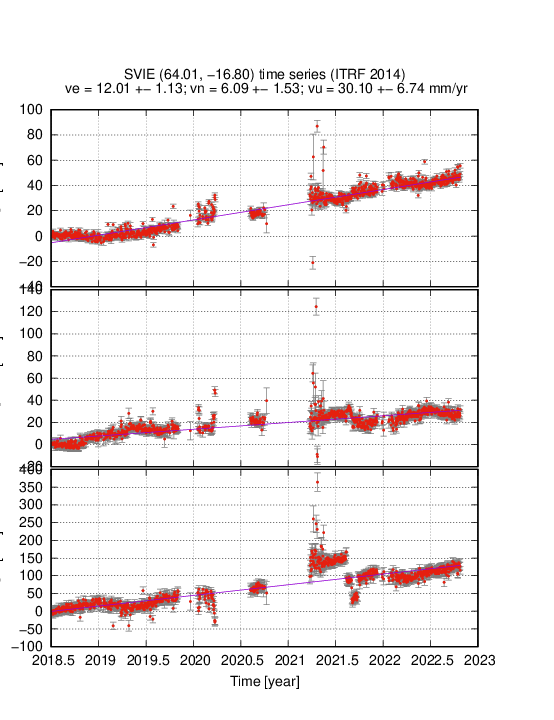
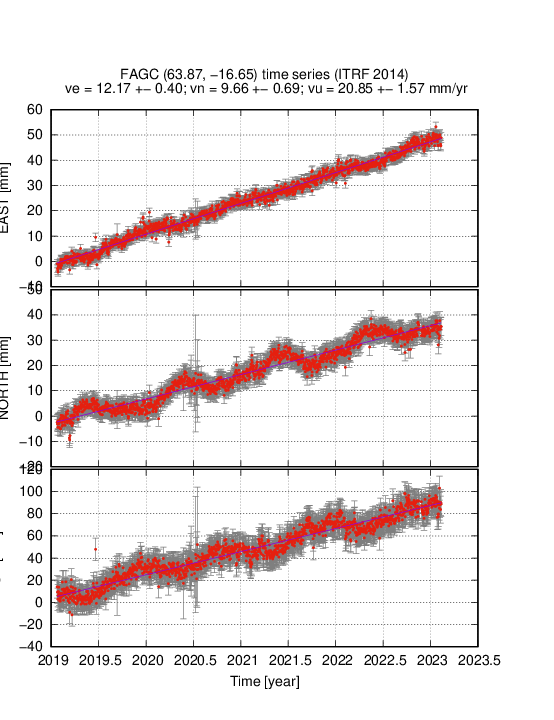
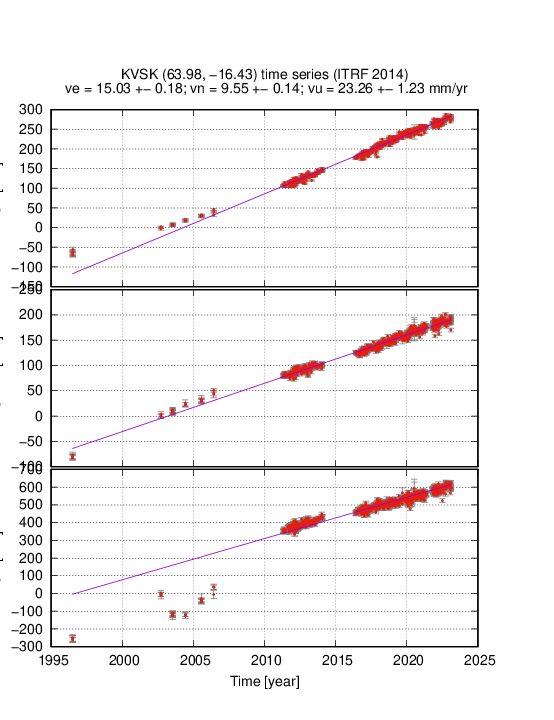
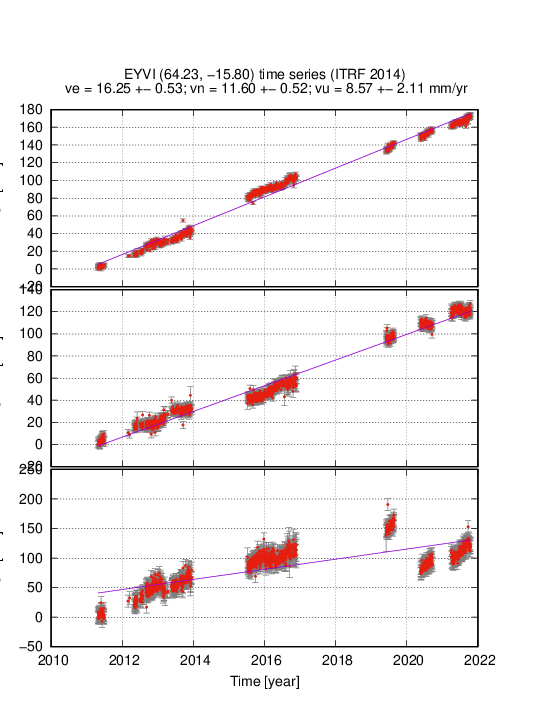
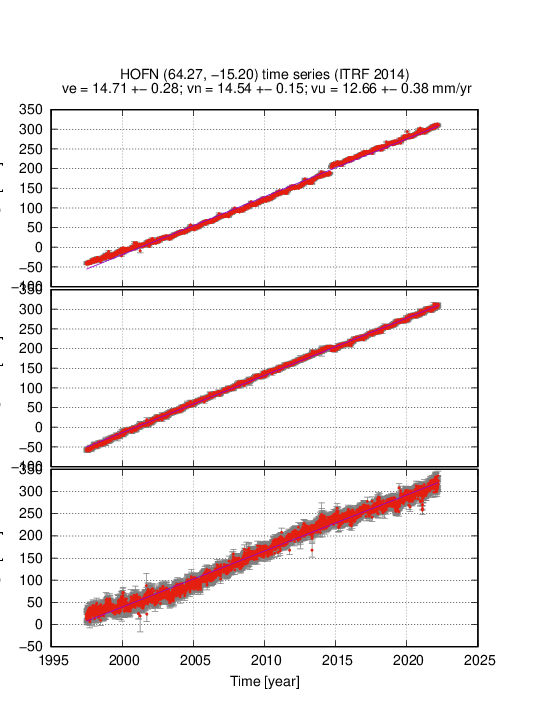
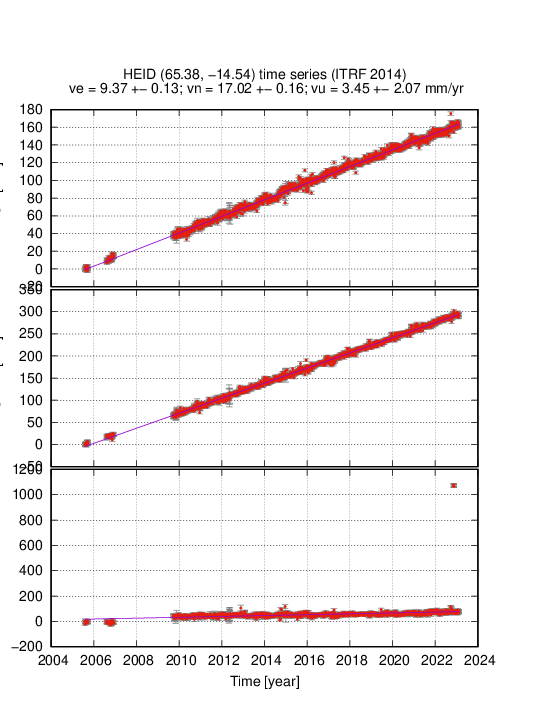
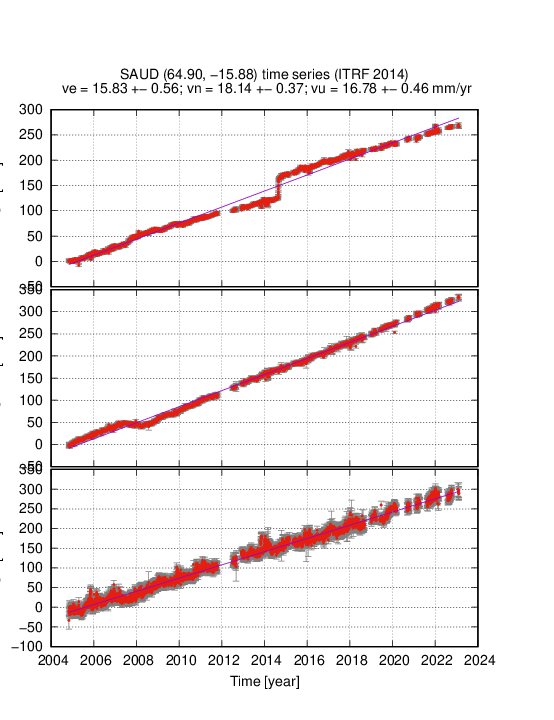
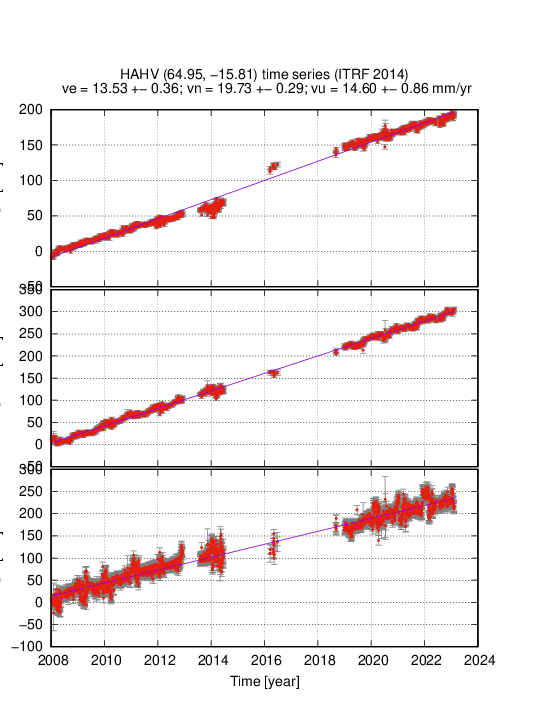
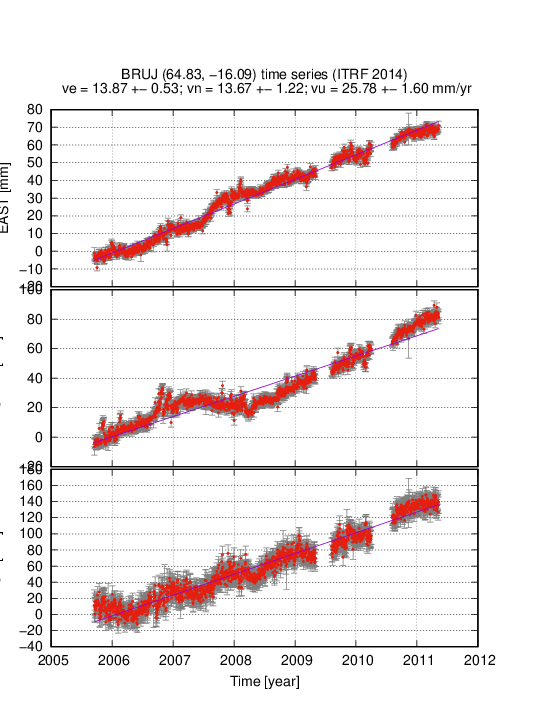
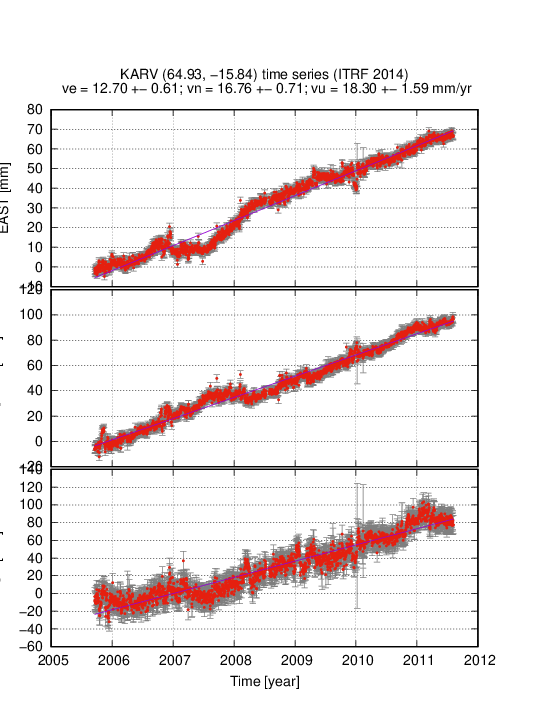
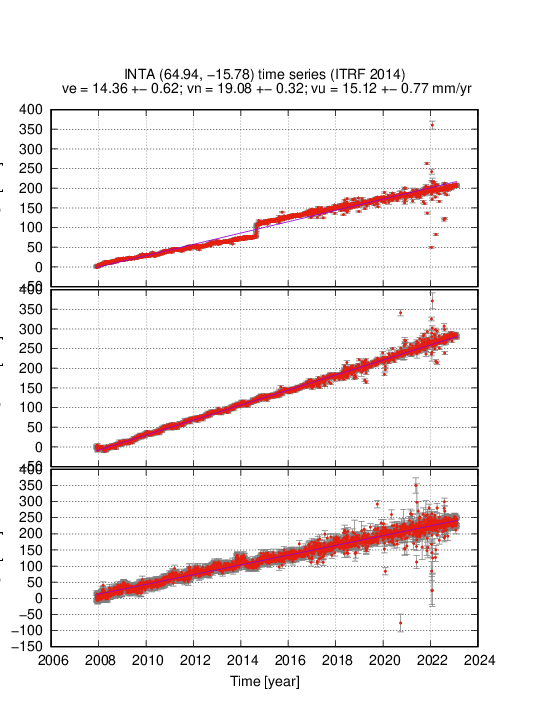
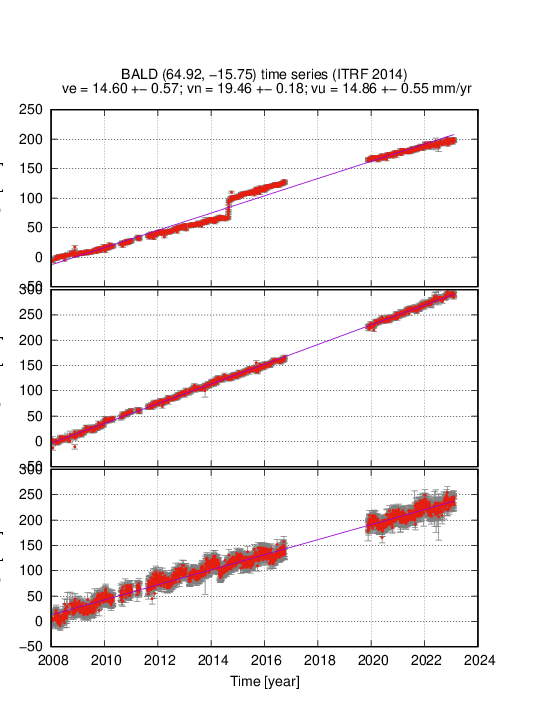
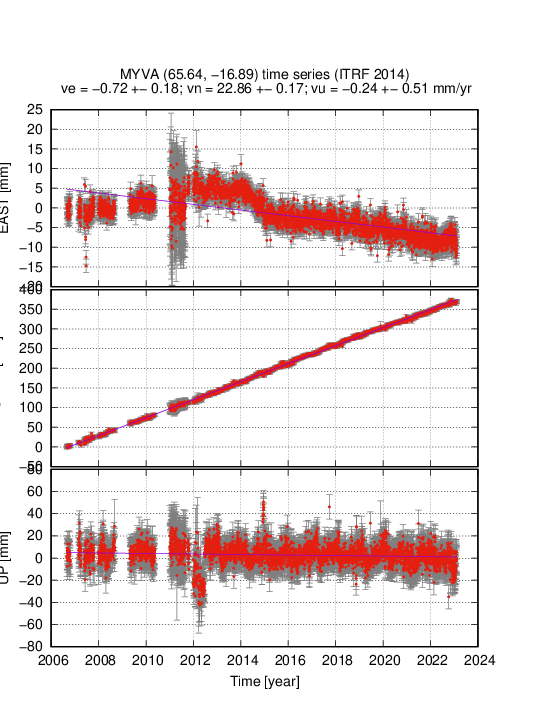
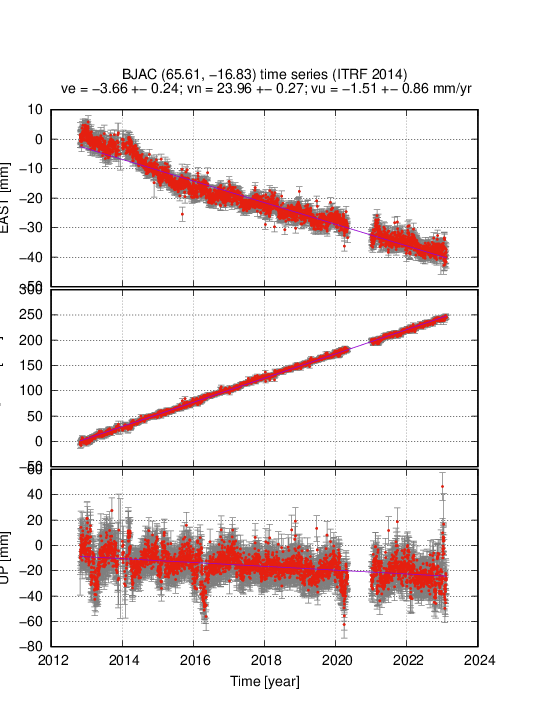
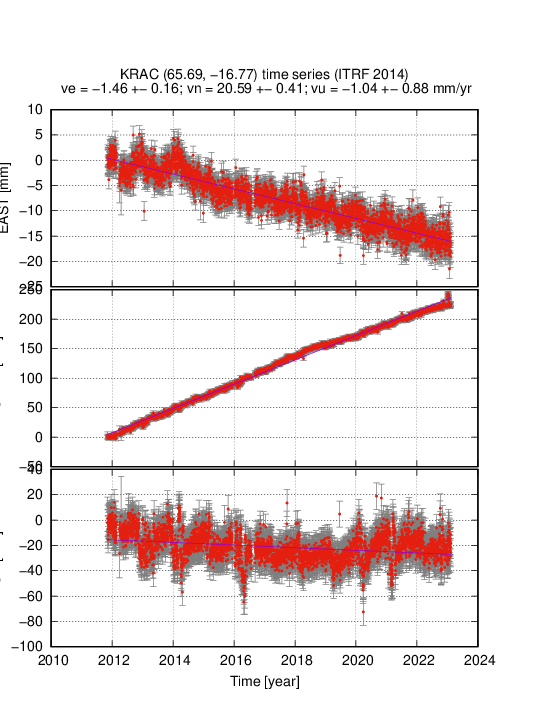
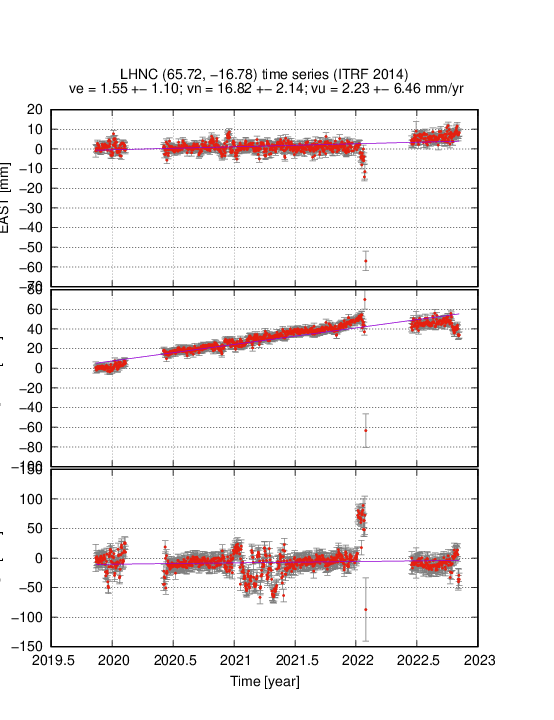
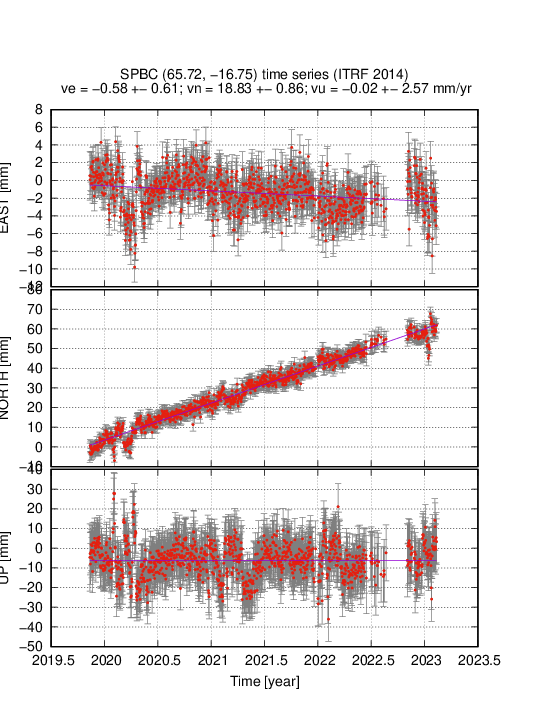
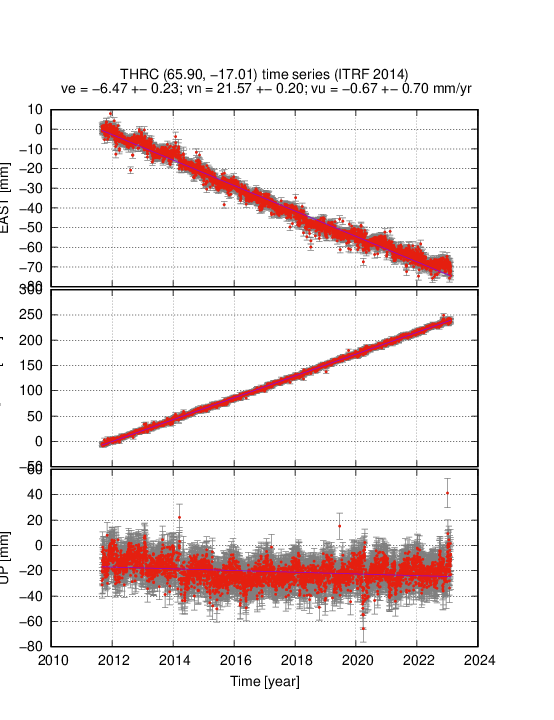
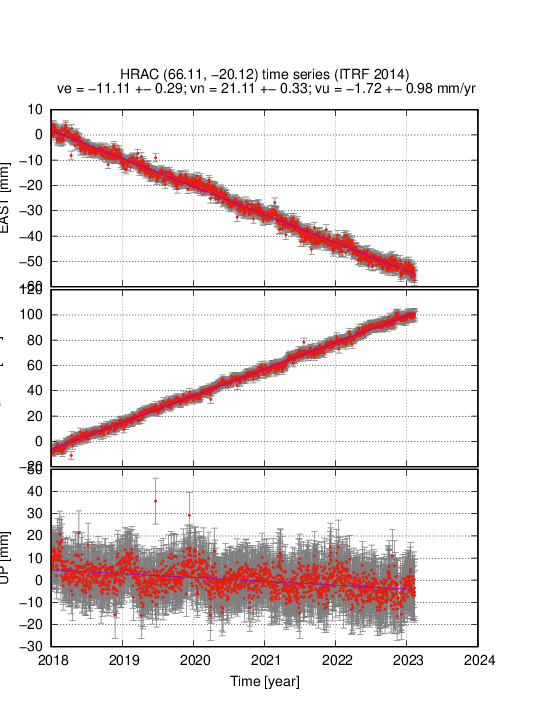
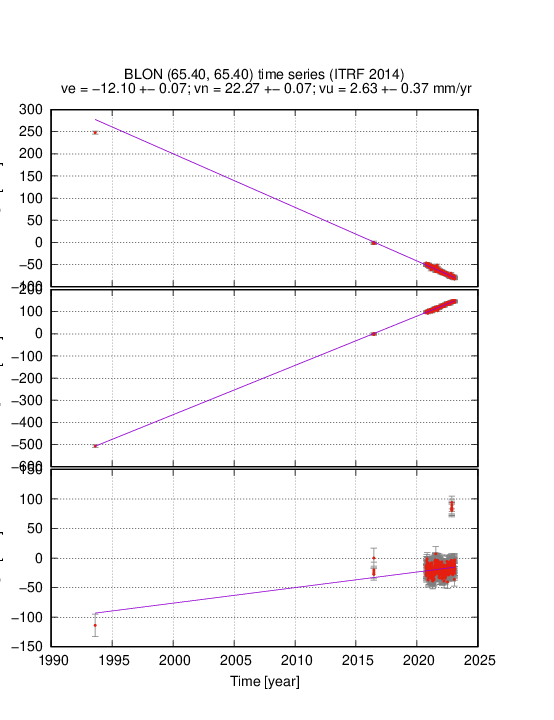
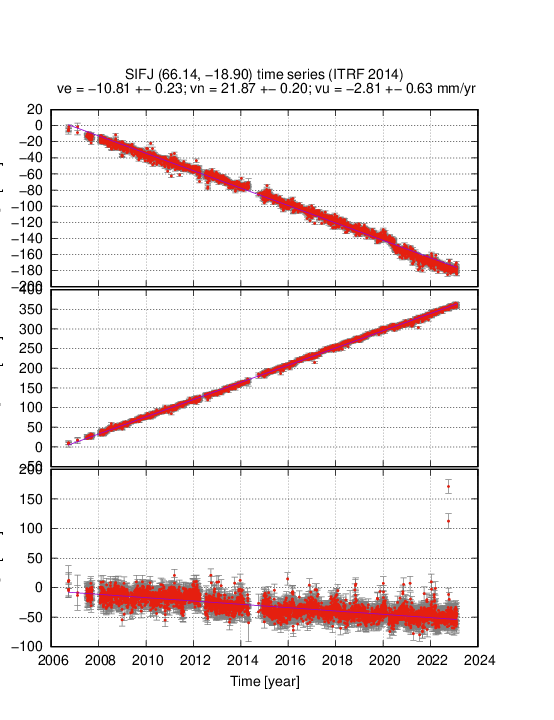
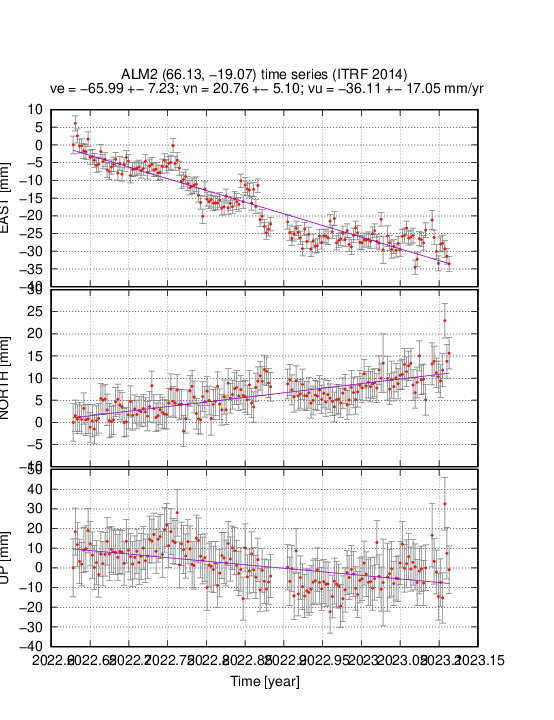
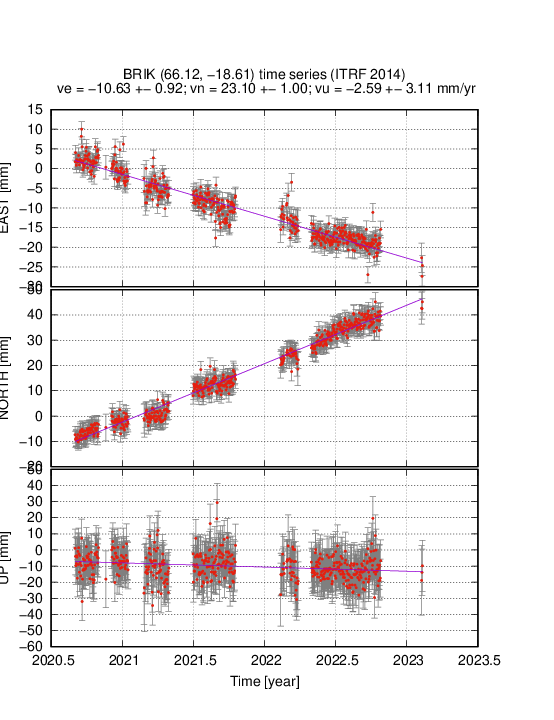
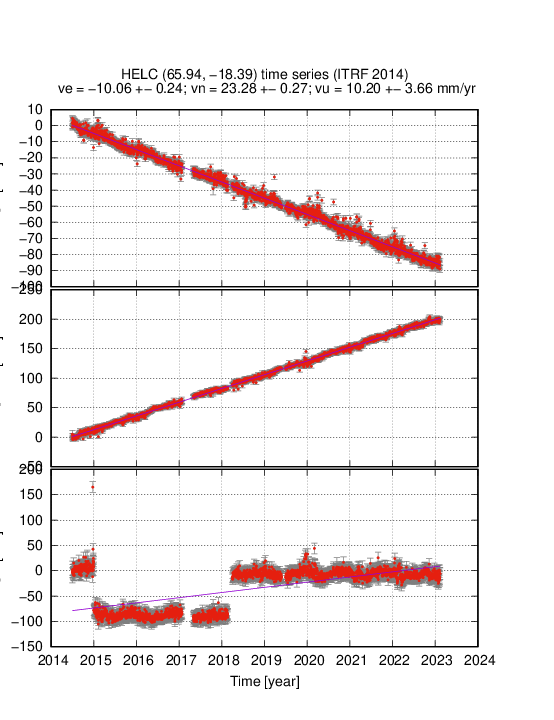
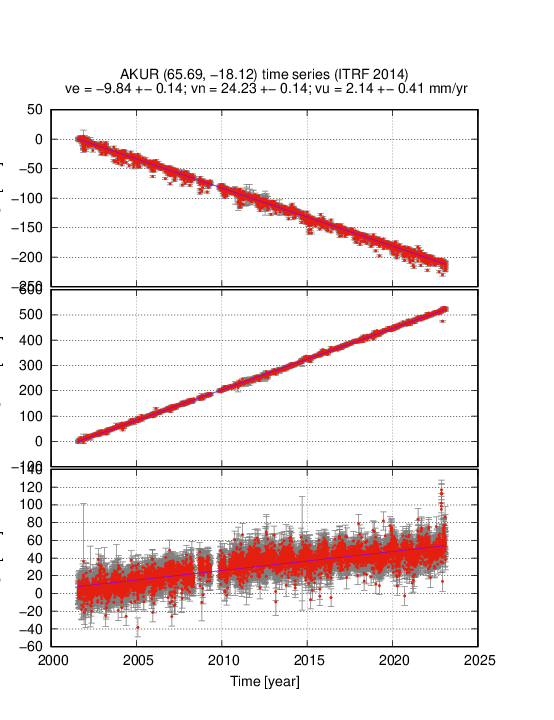
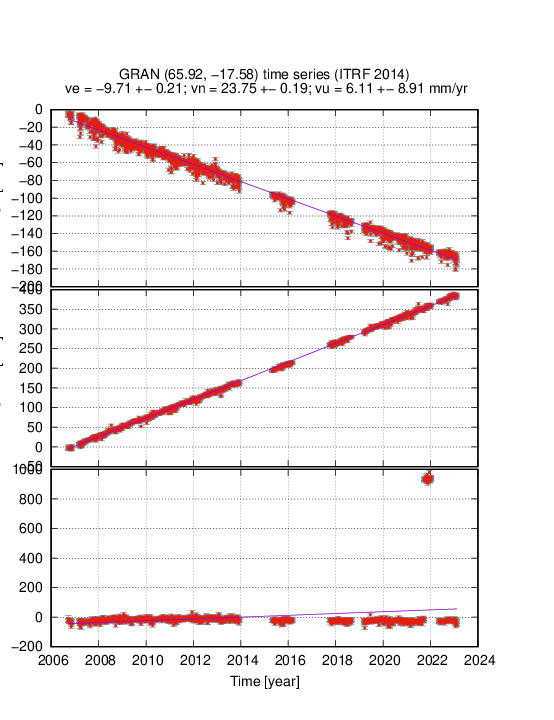
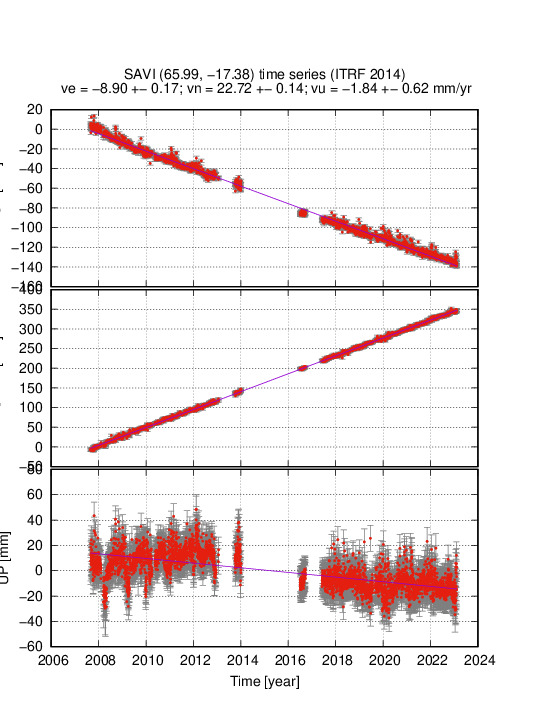
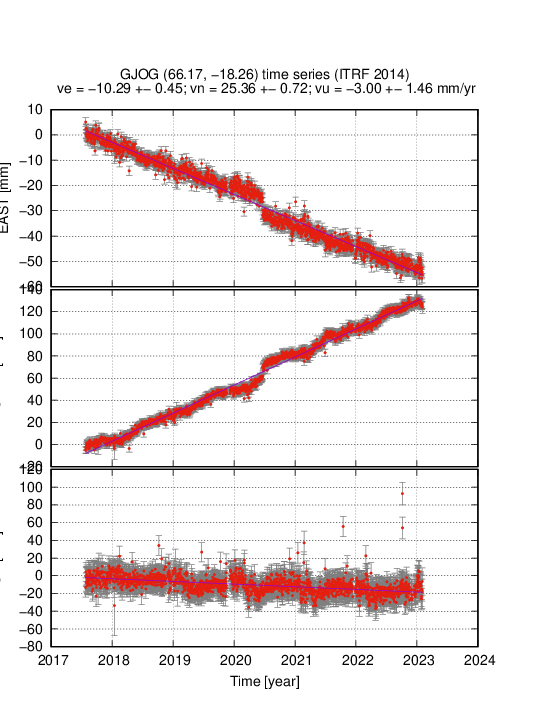
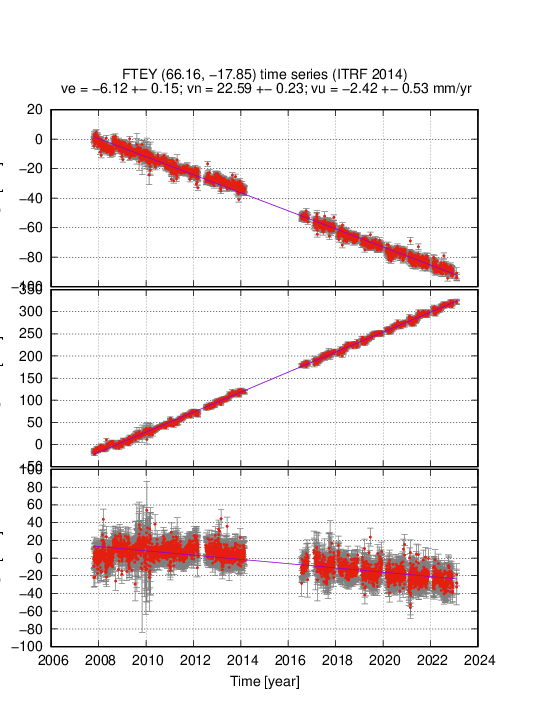
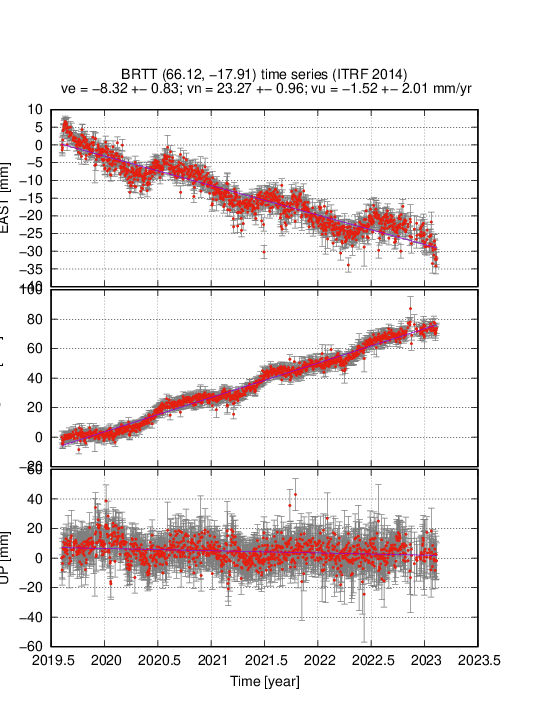
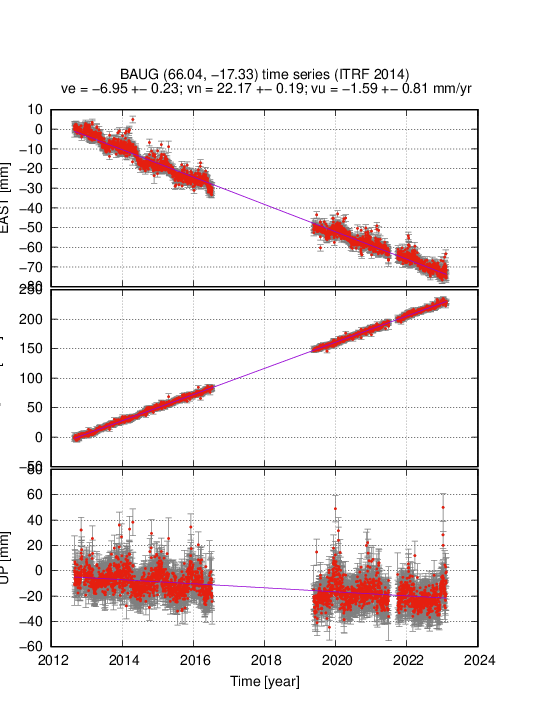
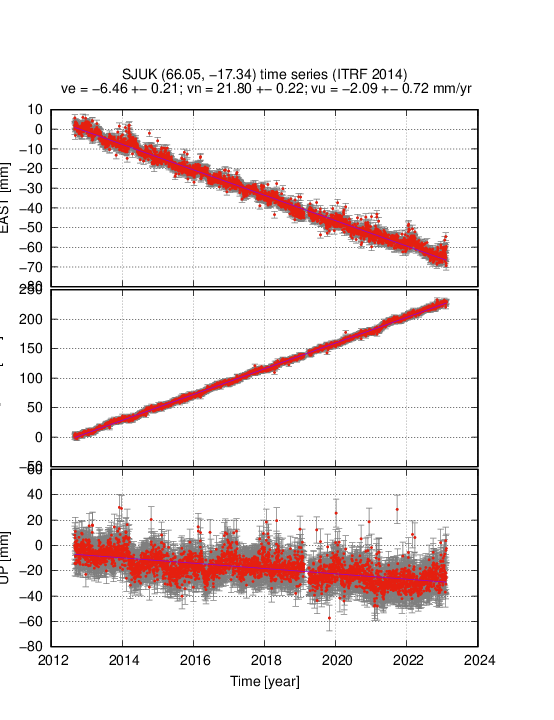
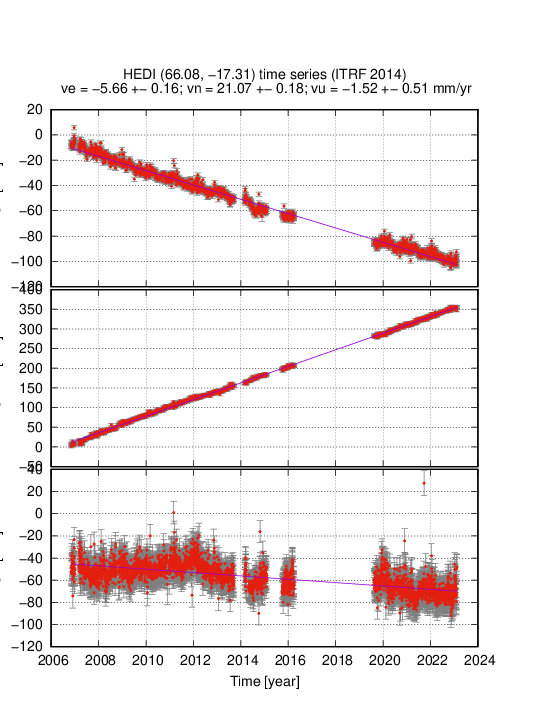
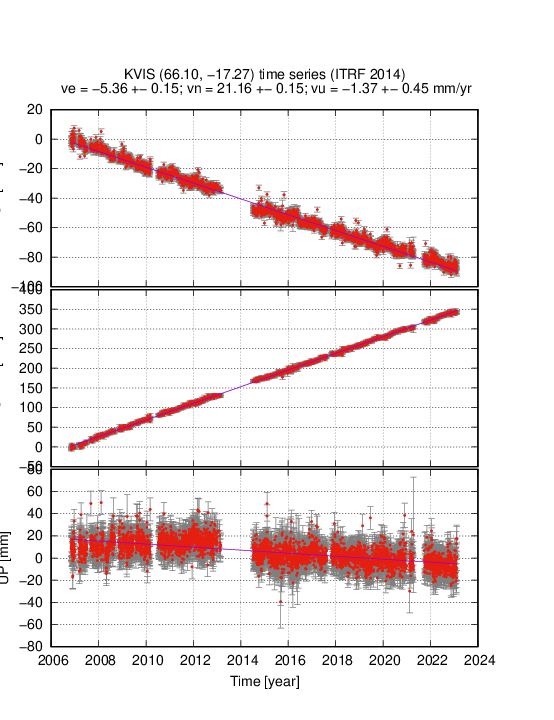
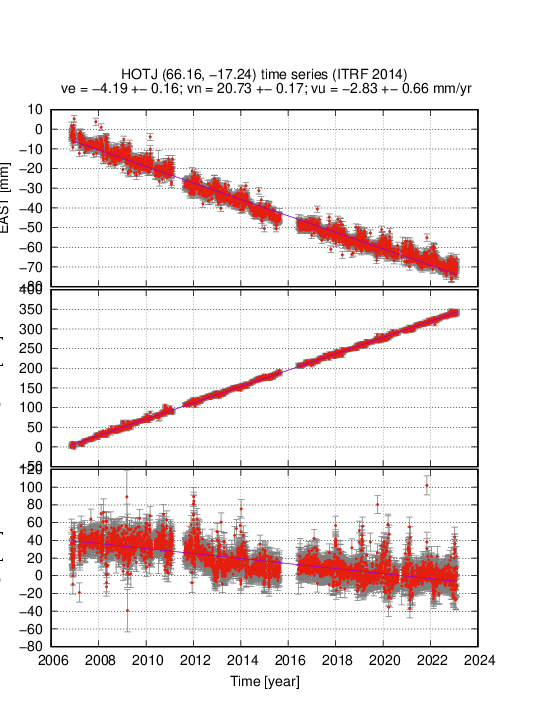
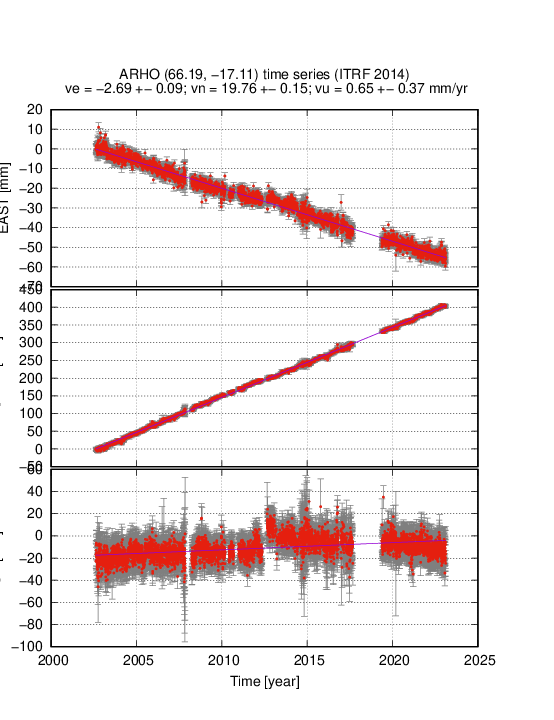
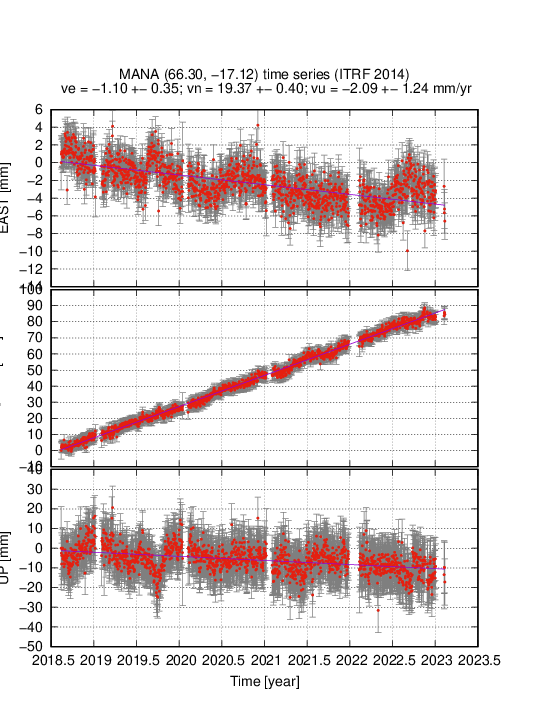
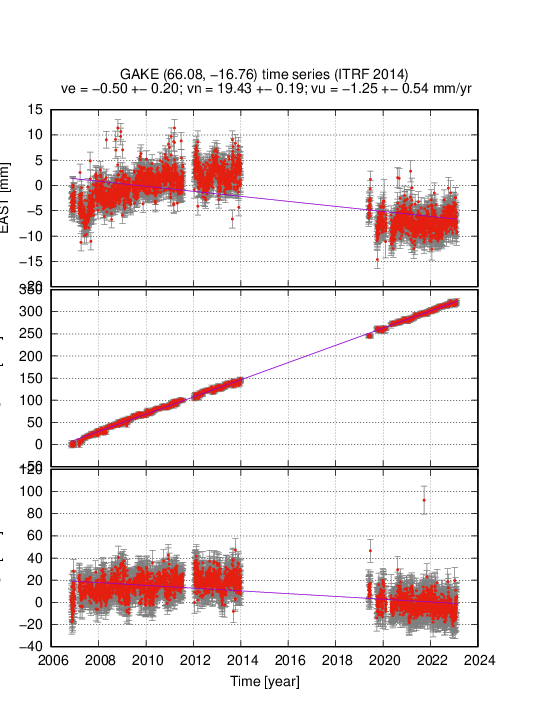
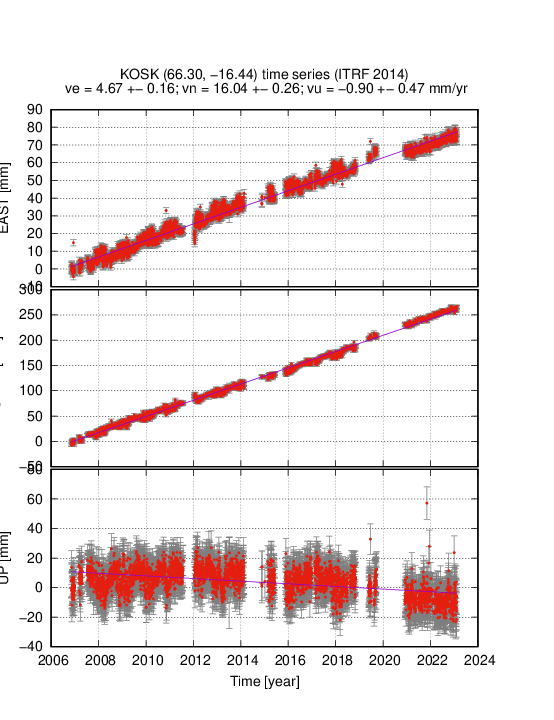
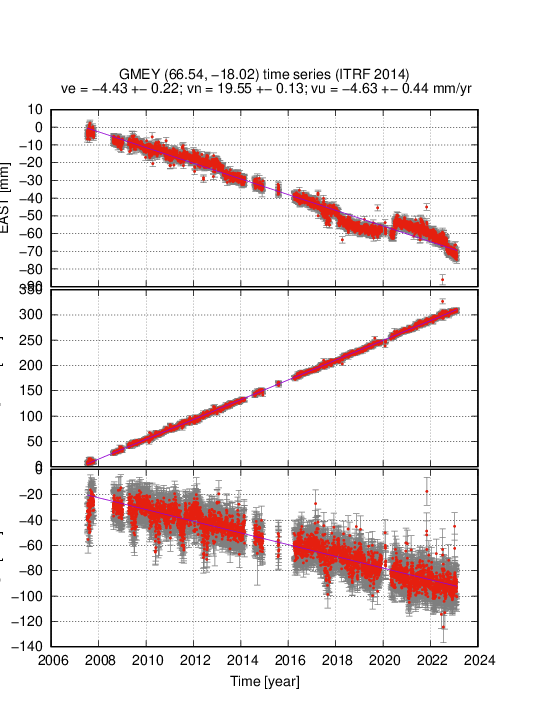
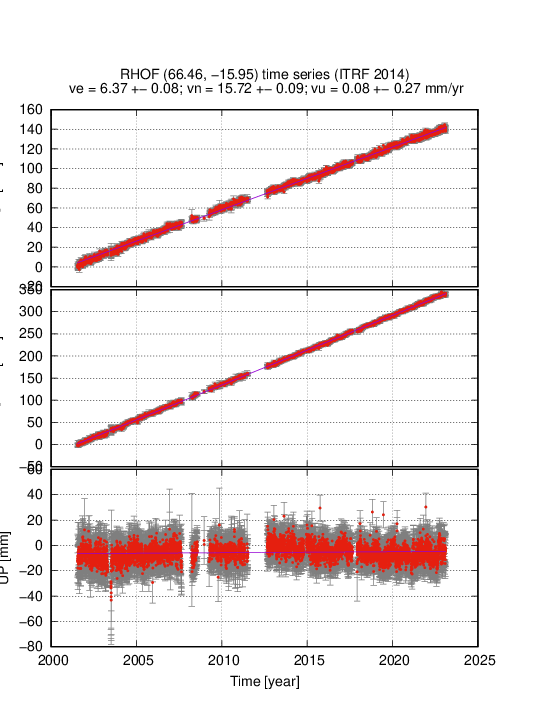
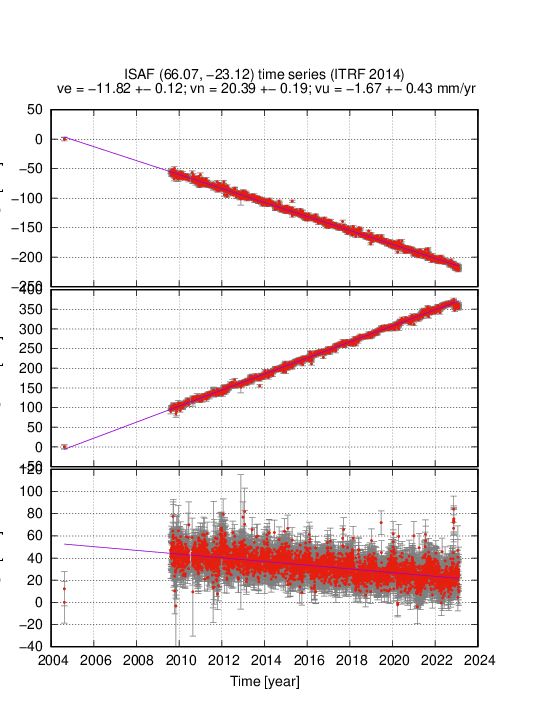
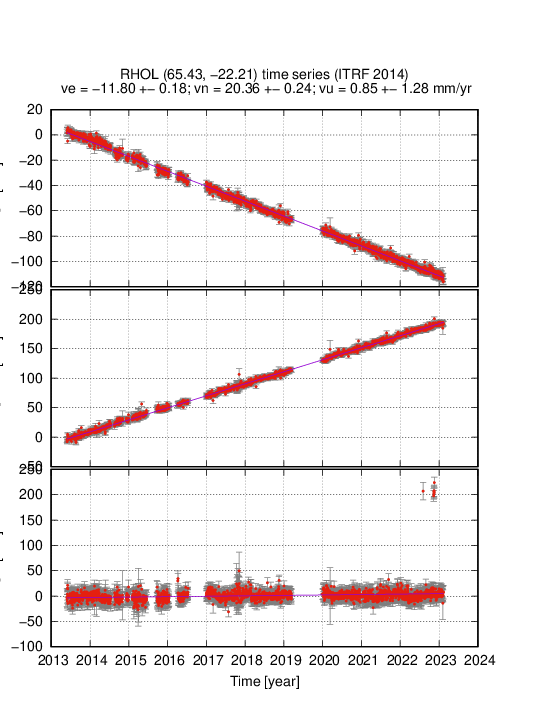
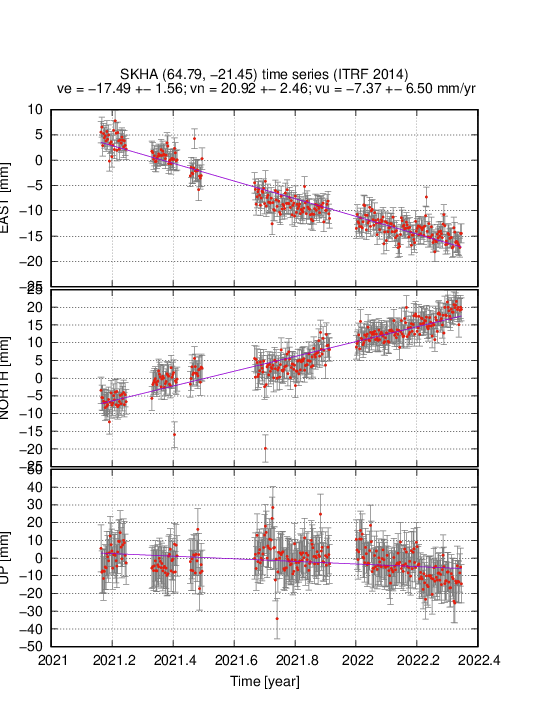
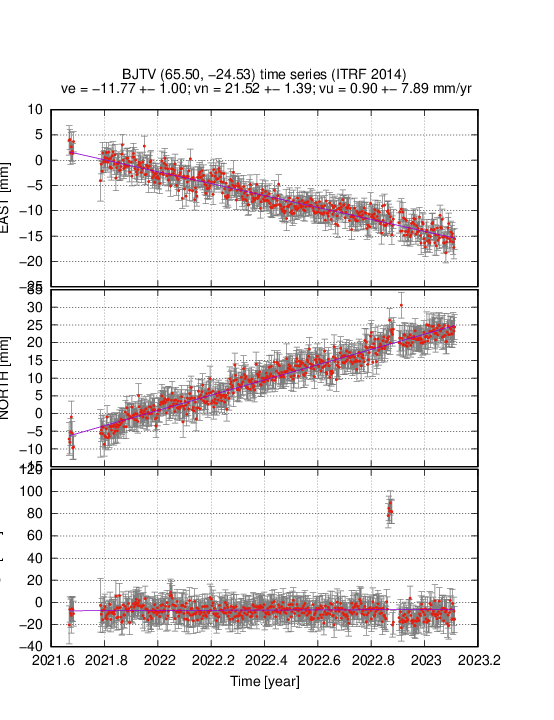
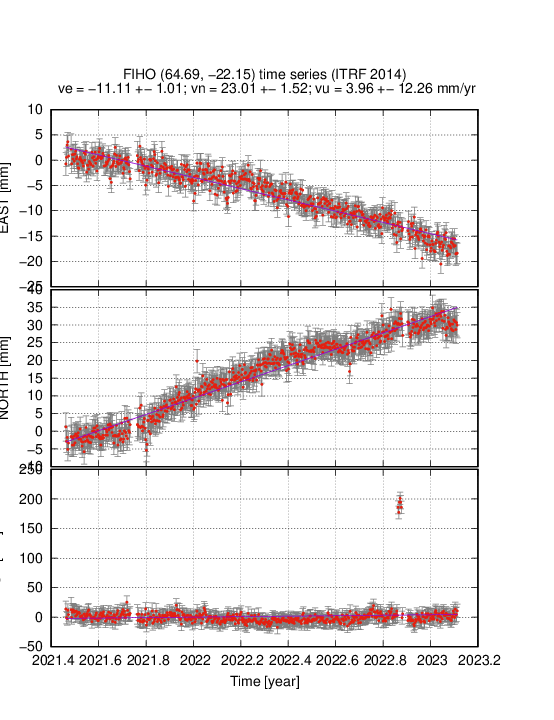
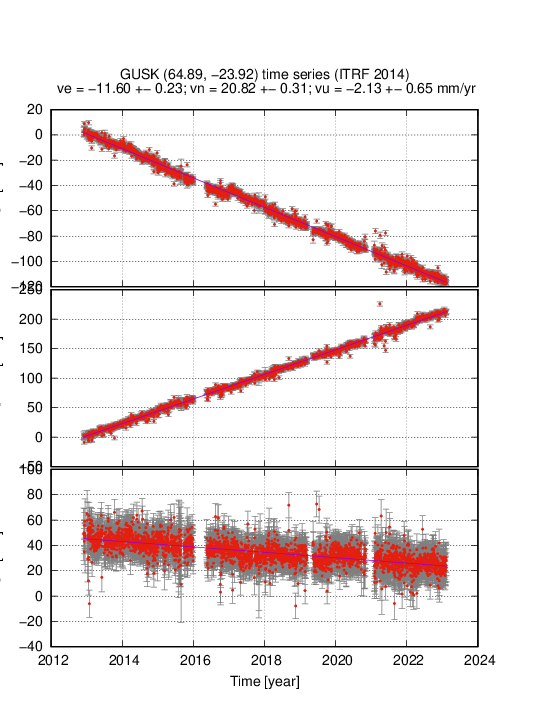
GPS time series results from GIPSY/OASIS PPP single site processing using JPL final orbits, in the ITRF2008 reference frame. Numbers in figure header indicate site coordinates and a roughly estimated mean velocity (blue line). Stations are ordred roughly from SW to NE. The images are updated on a weekly basis.
Data are from the ISGPS network with contributions from IMO (Icelandic Meteorological Office), PSU (The Pennsylvania State University), IES-UI (Institute of Earth Sciences - University of Iceland), NORDVULK (Nordic Volcanological Center), LMI (Icelandic National Land Survey), UA (University of Arizona), ETH (ETH - Zurich), KAUST (King Abdullah University of Science and Technology), US (University of Savoie), and BEK (Bavarian Academy of Sciences).
Please respect copyright of the results.
Time series plots for the last 100 days
Time series plots for the last 400 days
Final Time series:
Final time series
Residual time series
Final time series (some large events removed)
Residual (linear signal removed) time series (some large events removed)
Residual (linear and seasonal signals removed) time series (linear and seasonal signals removed, some large events removed as above)
Fit of seasonal signal
Other plots:
Combined plots for specific areas: Reykjanes Peninsula , Askja, Hengill, Krafla, Tungnakvislarjokulsskrida, Oraefi, Vatnajokull
Kinematic solutions: Reykjanes Peninsula, Grimsfjall, Hekla, Katla, SISZ, Other stations
Qc plots Site voltage plots