
| Jarðvísindastofnun Háskóla Íslands - Institute of Earth Sciences, University of Iceland
Mælingar á færslum á skriðu við Tungnakvíslarjökul / Measurements of displacements of a landslide near Tungnakvíslarjökull |
|---|
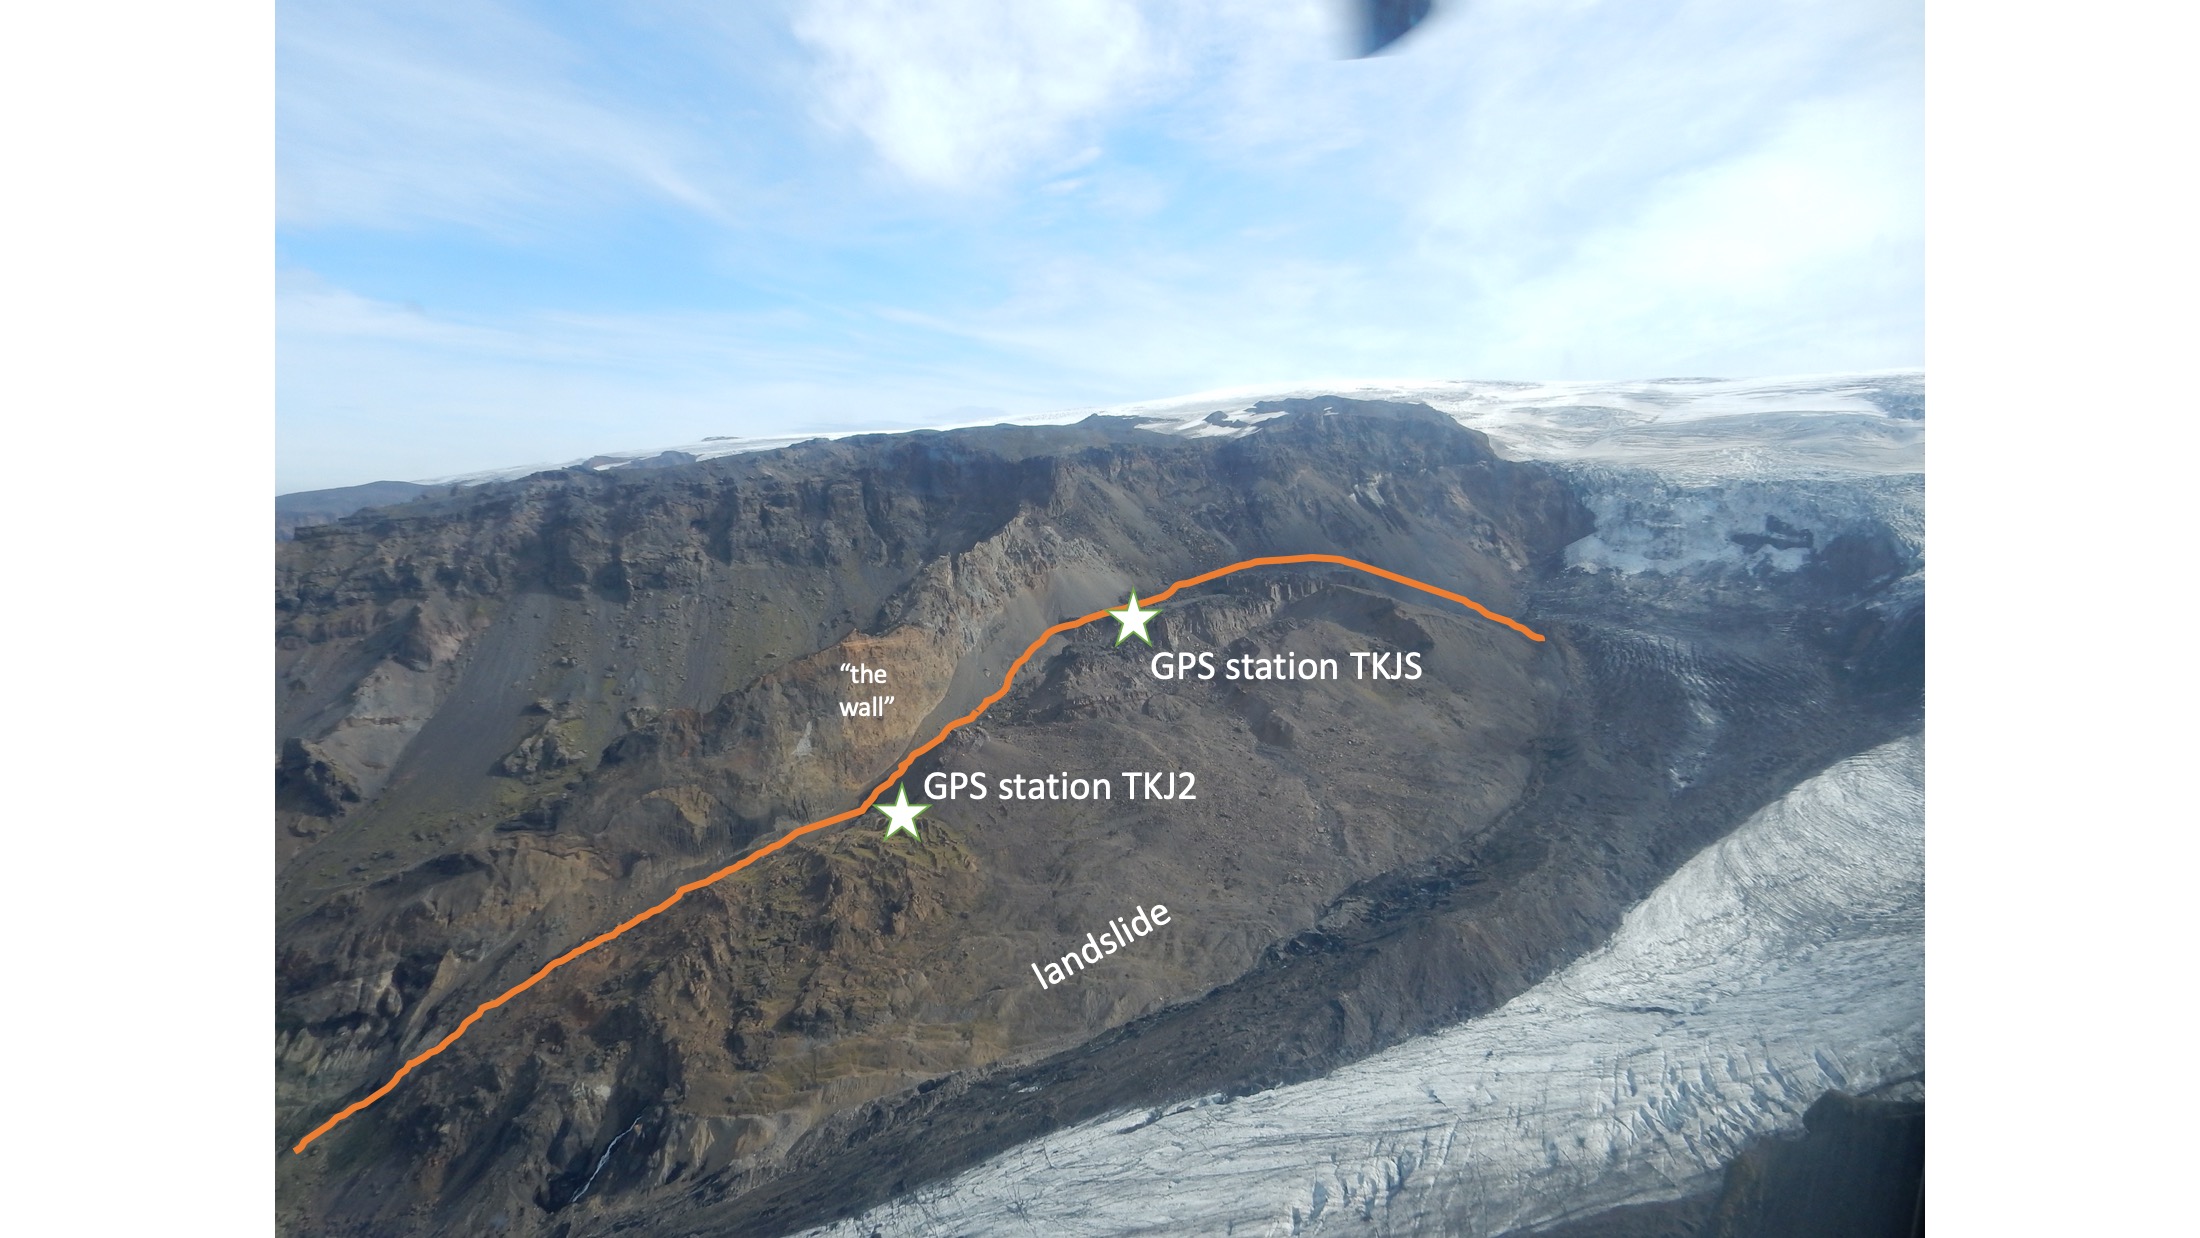
Þann 16. ágúst 2019 var komið fyrir GNSS (GPS) mælistöð (TKJS) til samfelldra mælinga í bergsili (hægfara skriðu) ofan við Tungnakvíslarjökul, sjá mynd að ofan. Þann 30. júní 2020 var annarri mælistöð bætt við neðar í skriðunni (TKJ2).
Að neðan má finna niðurstöður mæliraða fyrir nokkur mismunandi tímabil. Vinsamlegast virðið höfundarétt niðurstaðna.
A continuously recording GNSS/GPS station, TKJS, was installed on a rotational landslide near Tungnakvíslarjökull glacier in August 2019, see figure above. In June 2020 a second station, TKJ2, was installed further down in the landslide.
Below you can find time series of results from this station for a few different time intervals. Please respect authorship of the results.
The images are updated several times per day. Click on any image to see it in higher resoltion.
Order of figures: Last 100 days (daily positions), last 400 days (daily positions), velocity map for different time intervals, last 3 days (positions at 5 min interval), last 10 days (positions at 5 min interval)
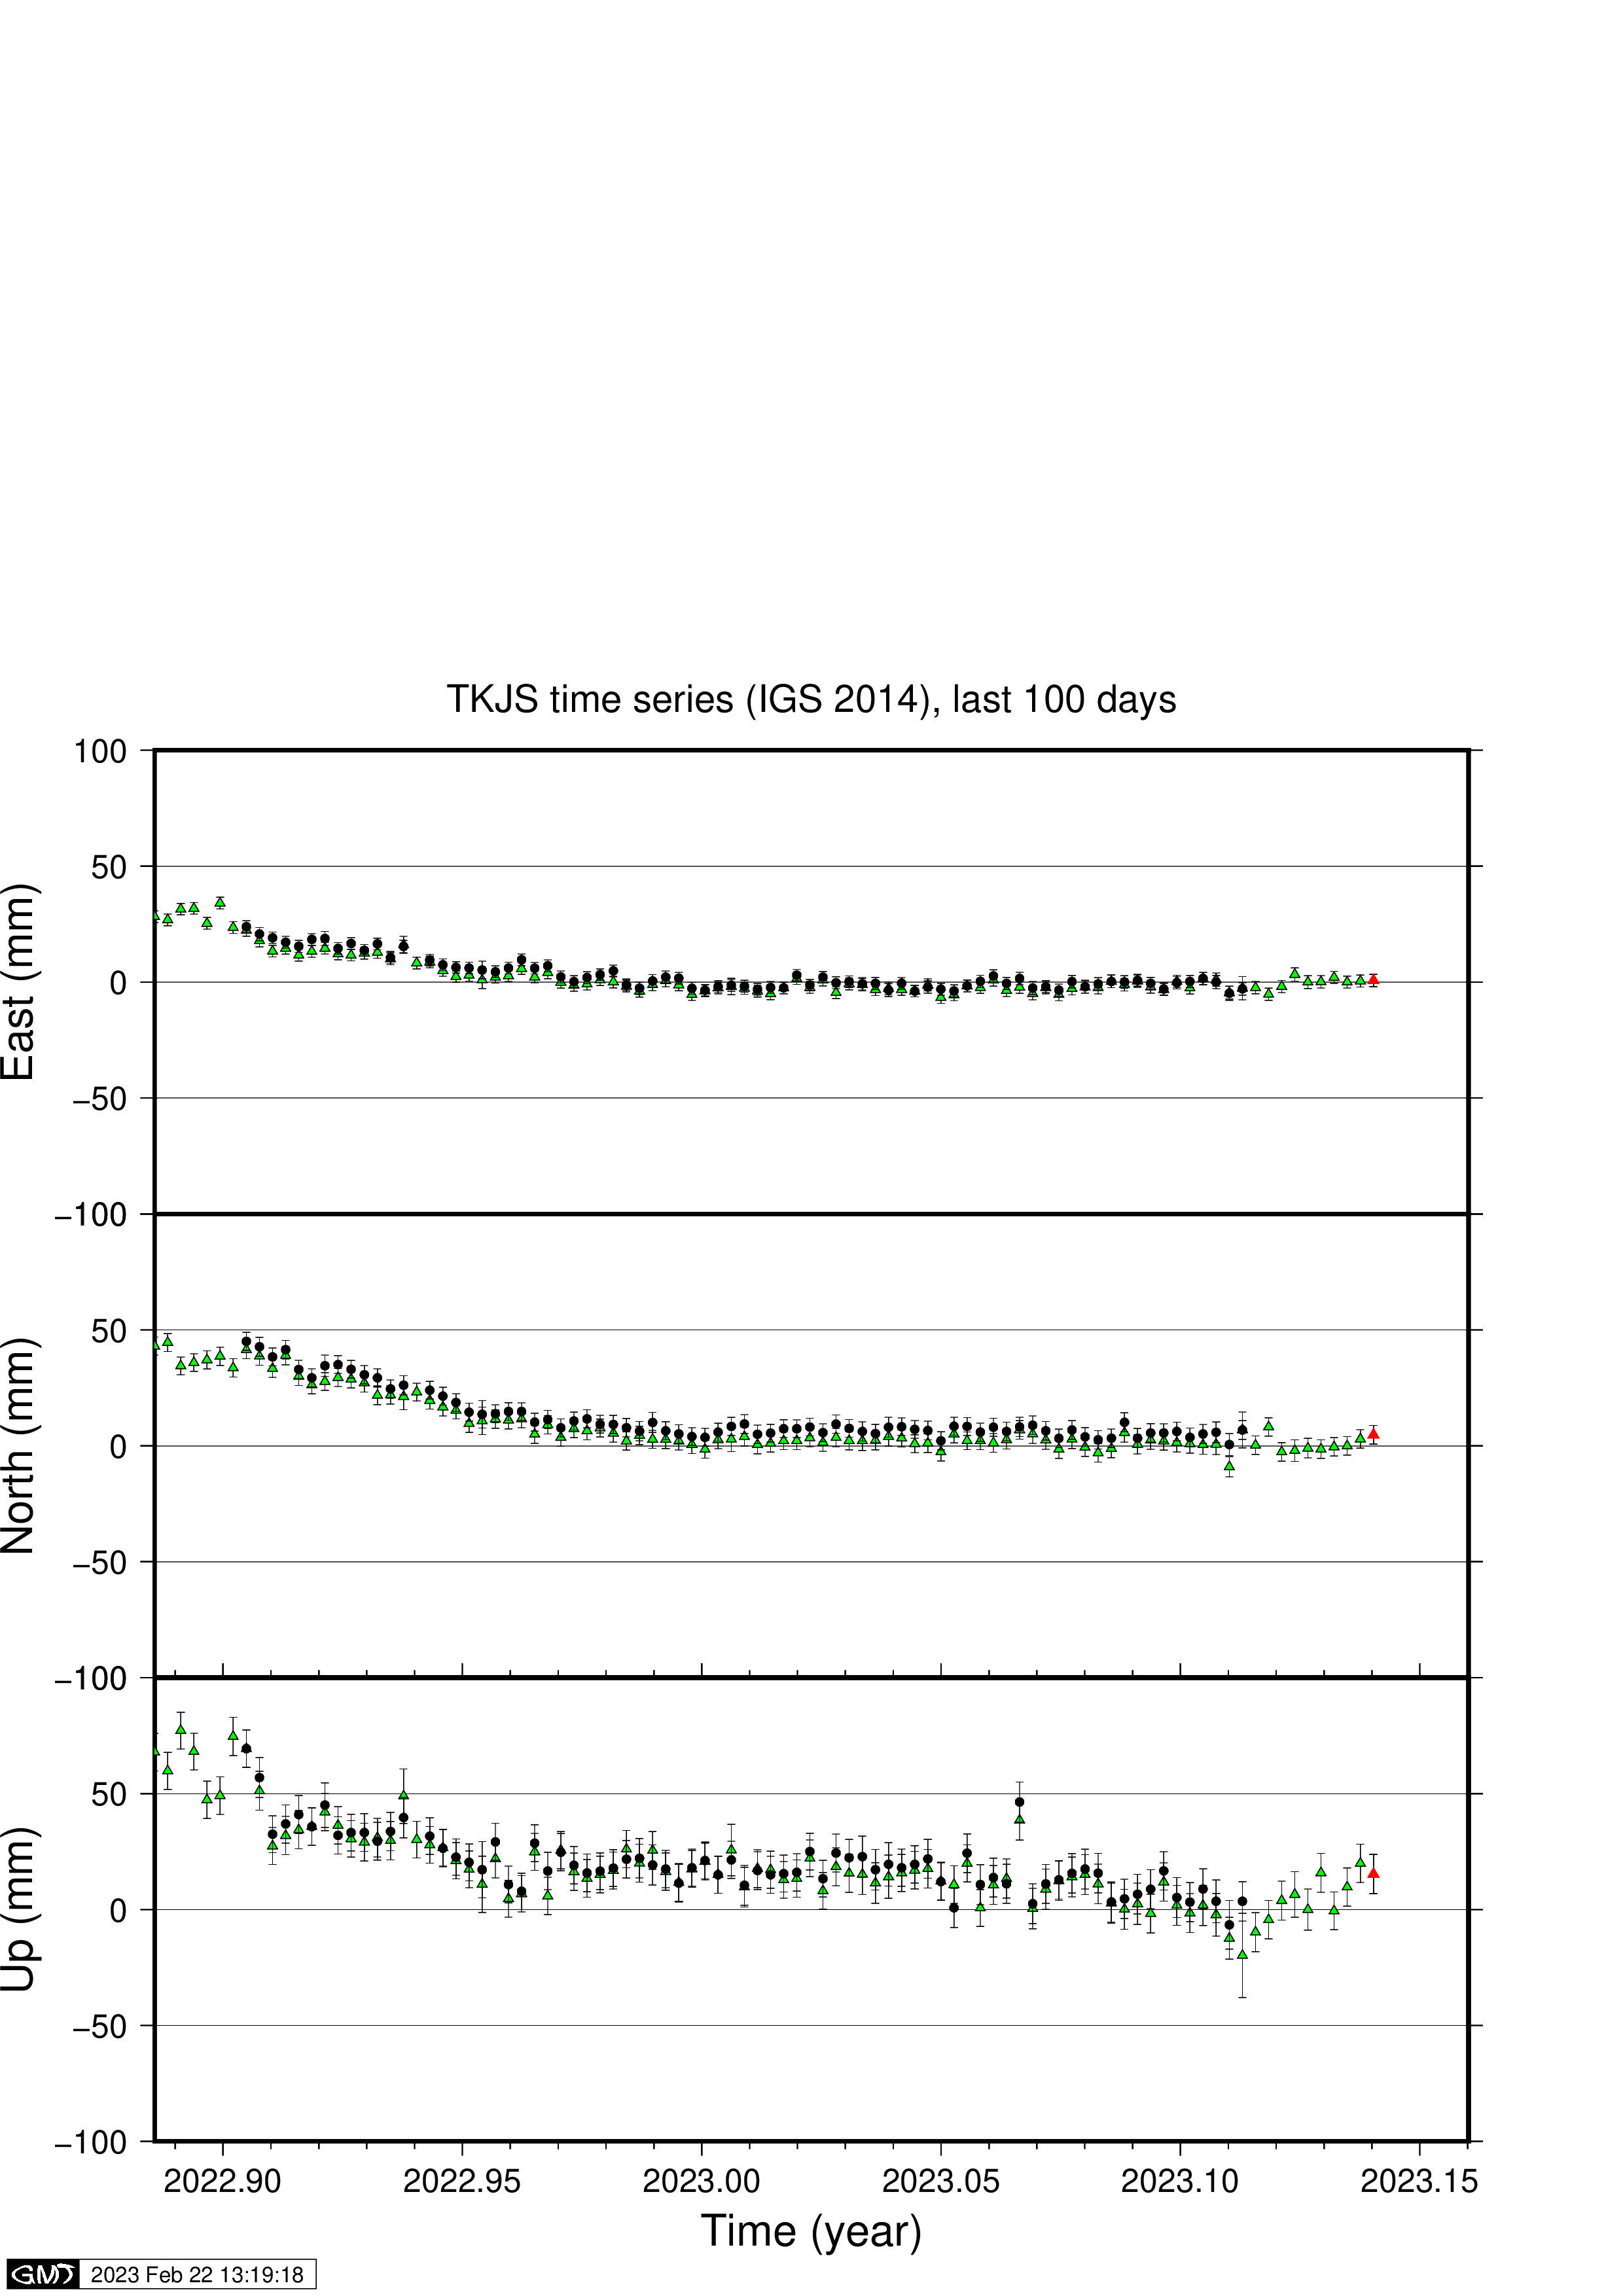
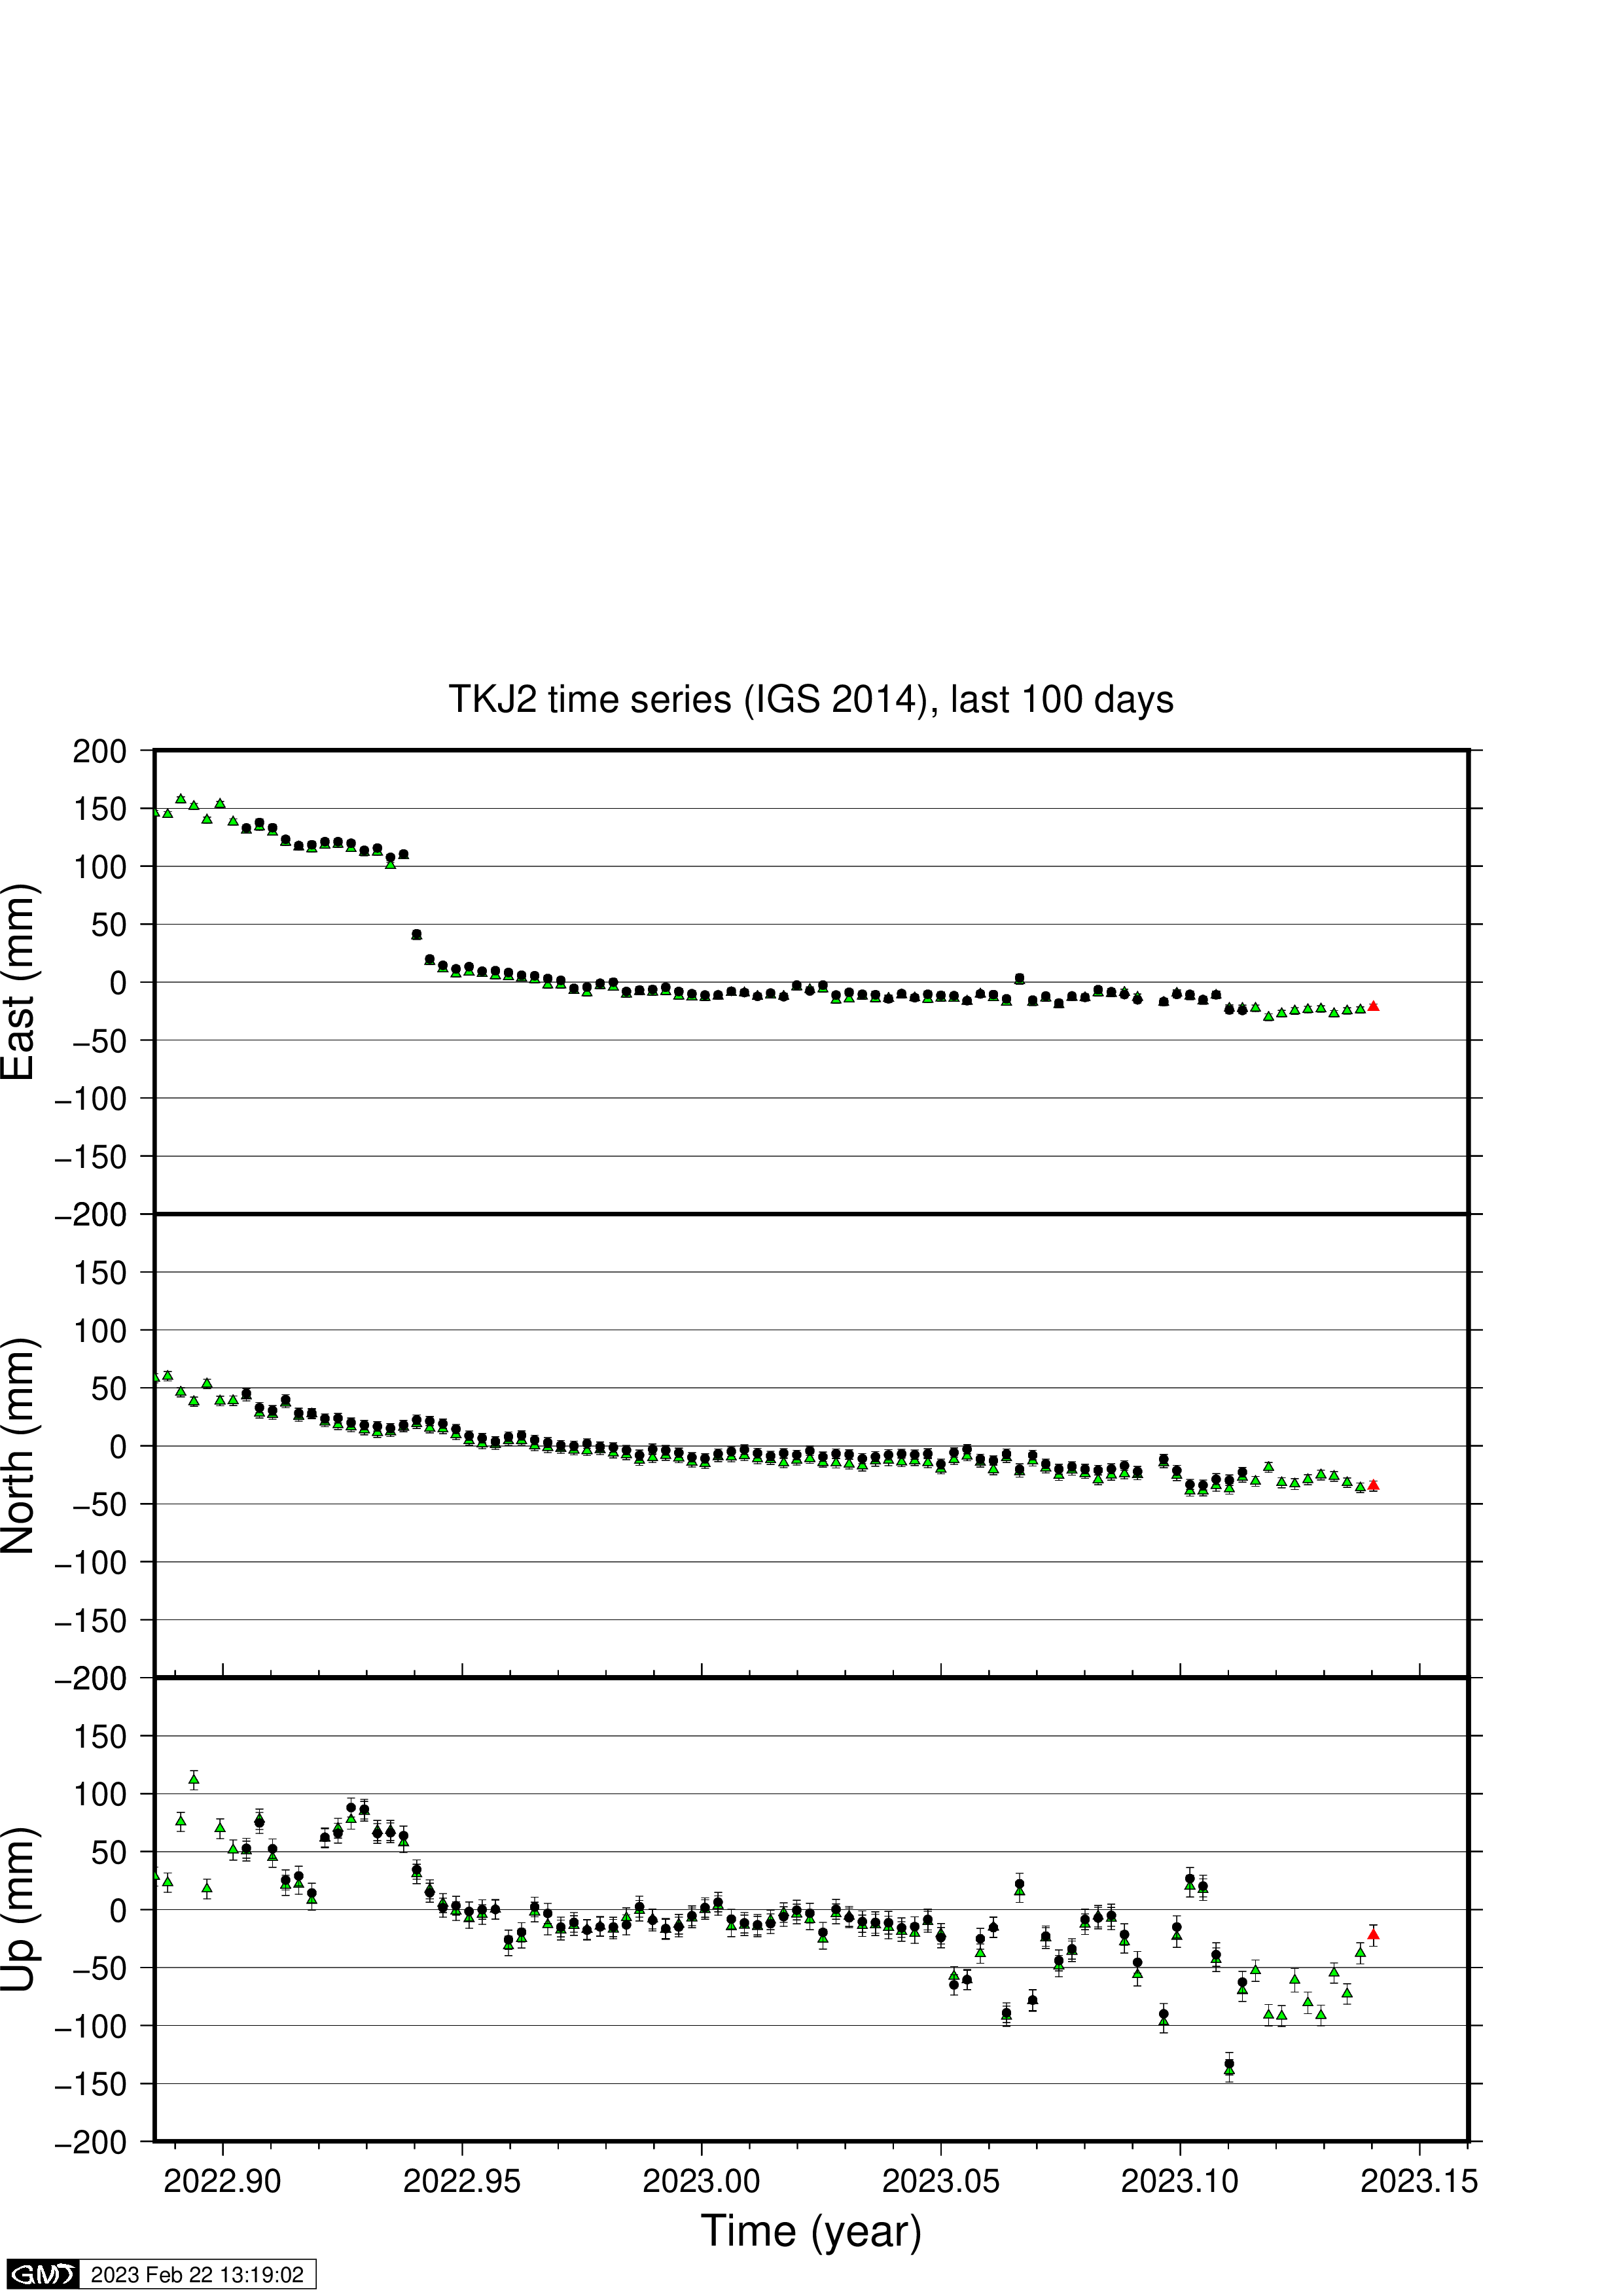
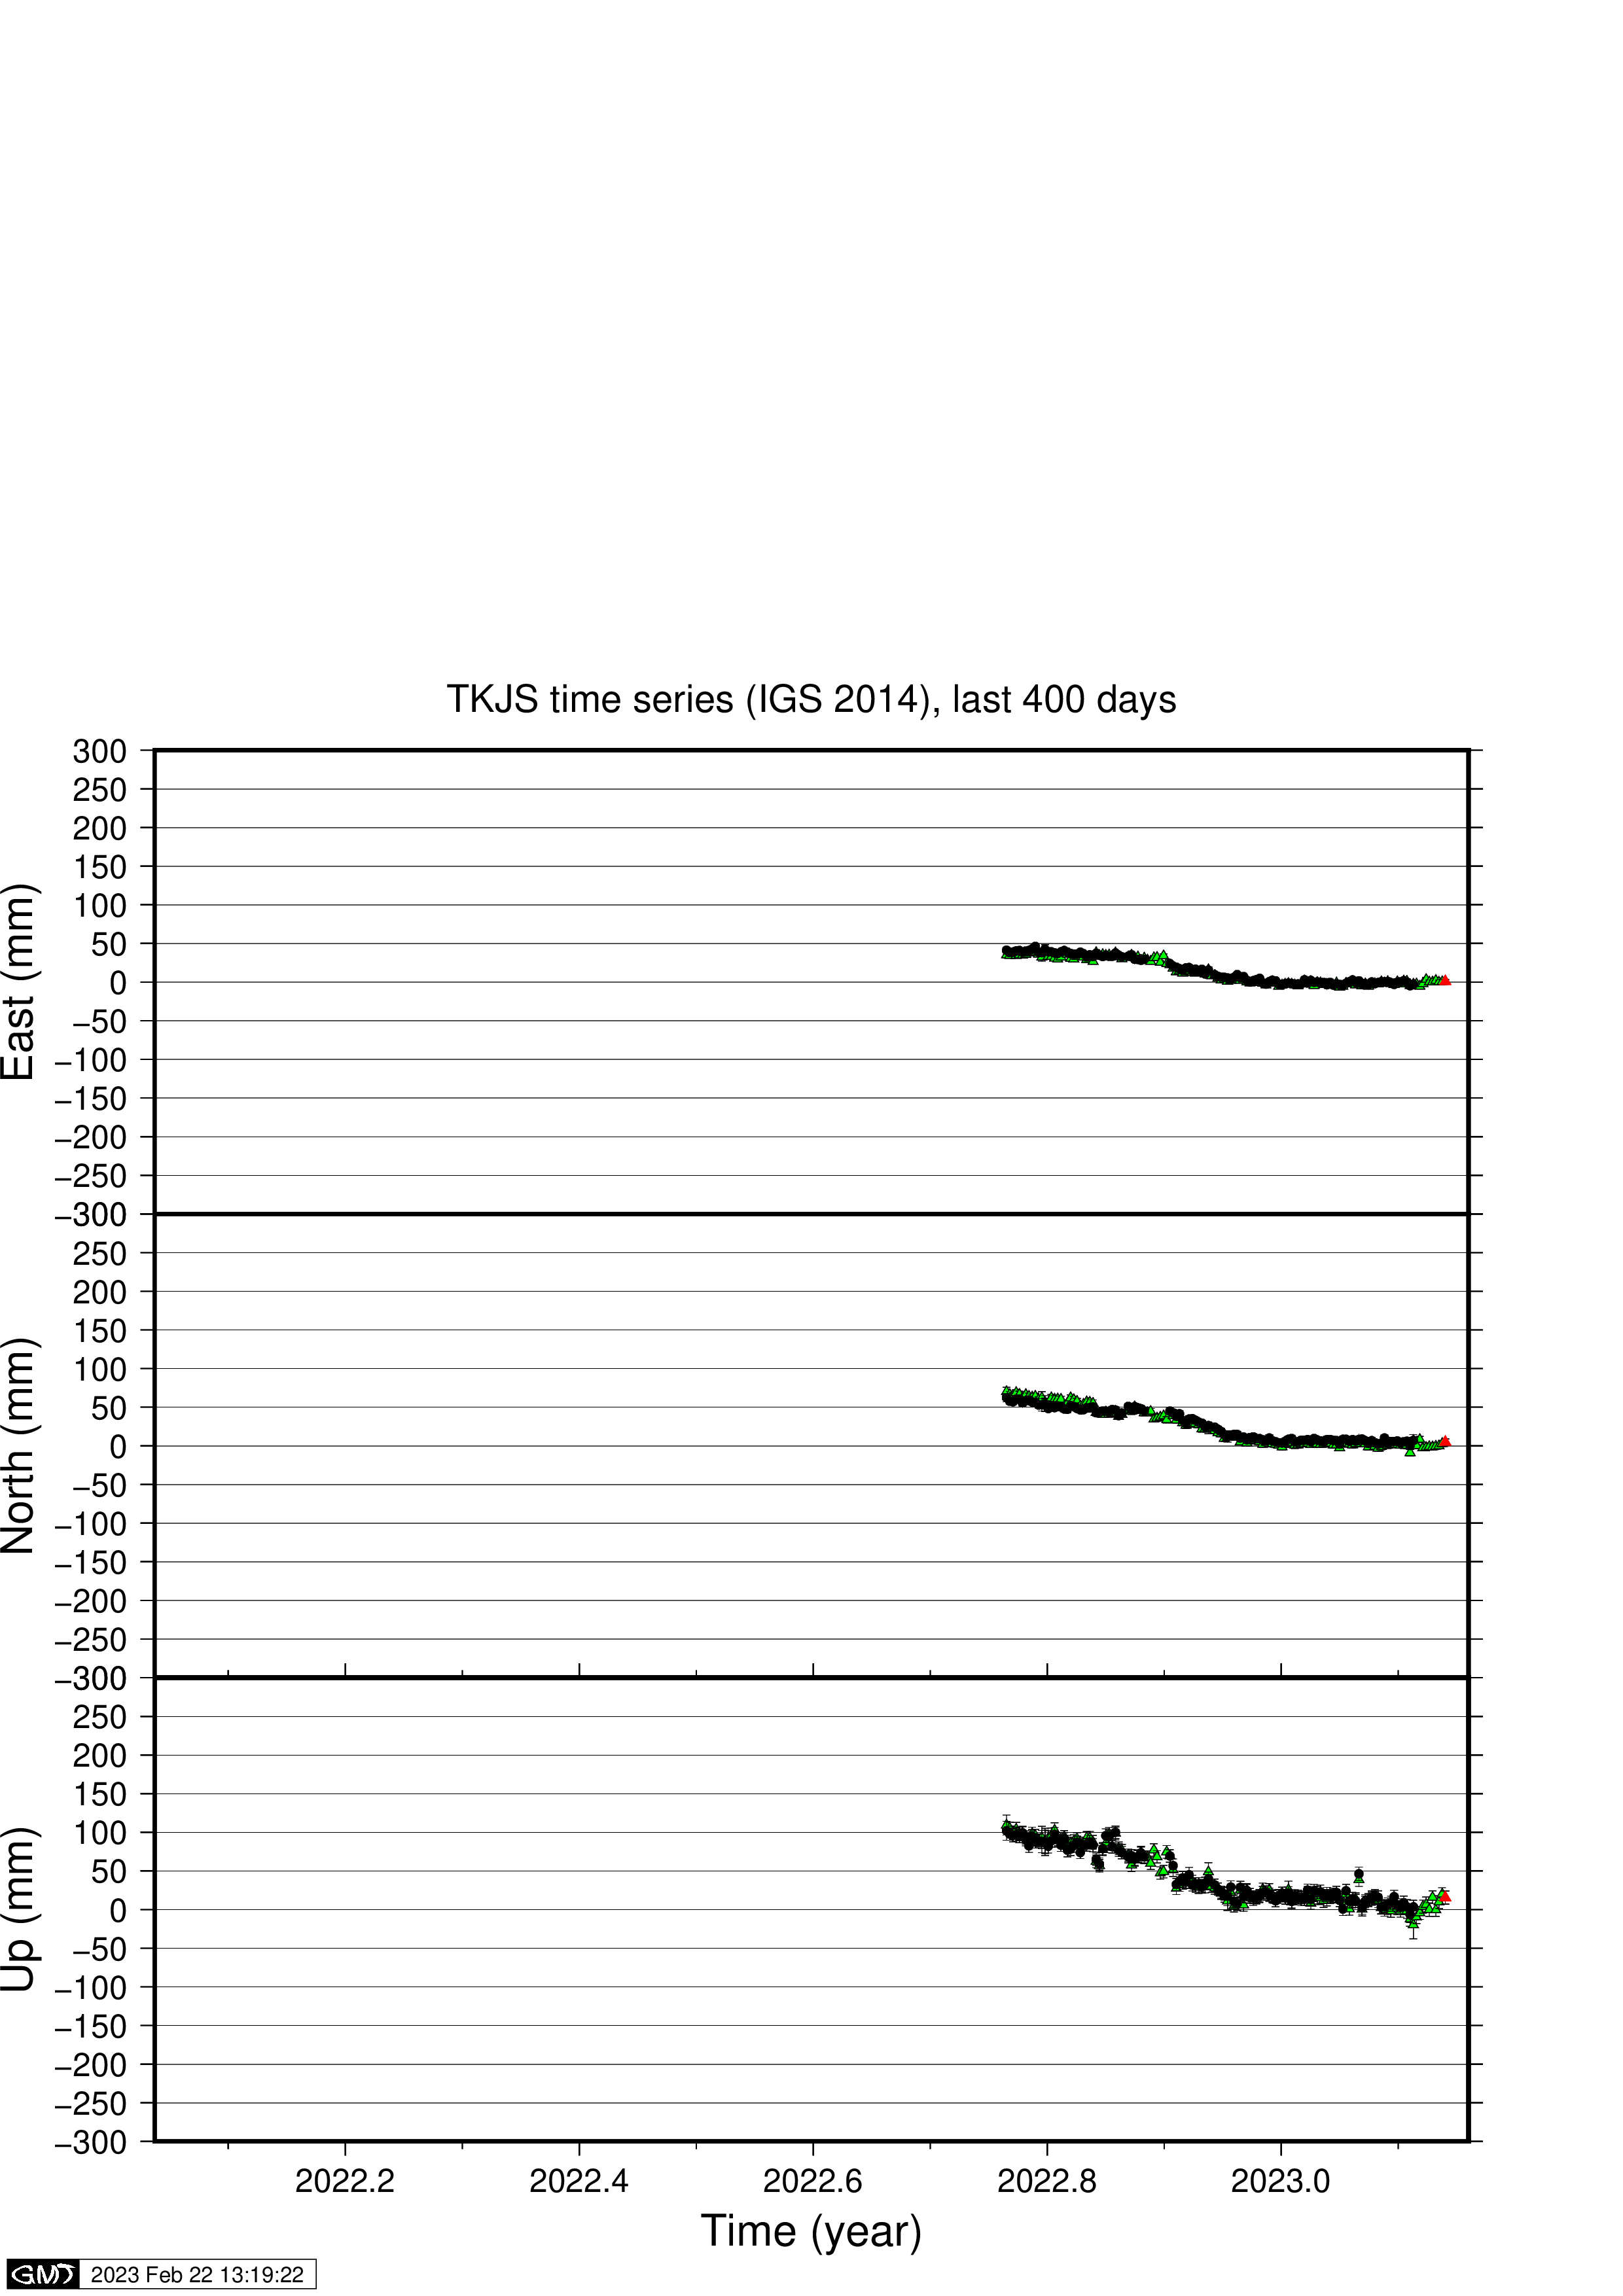
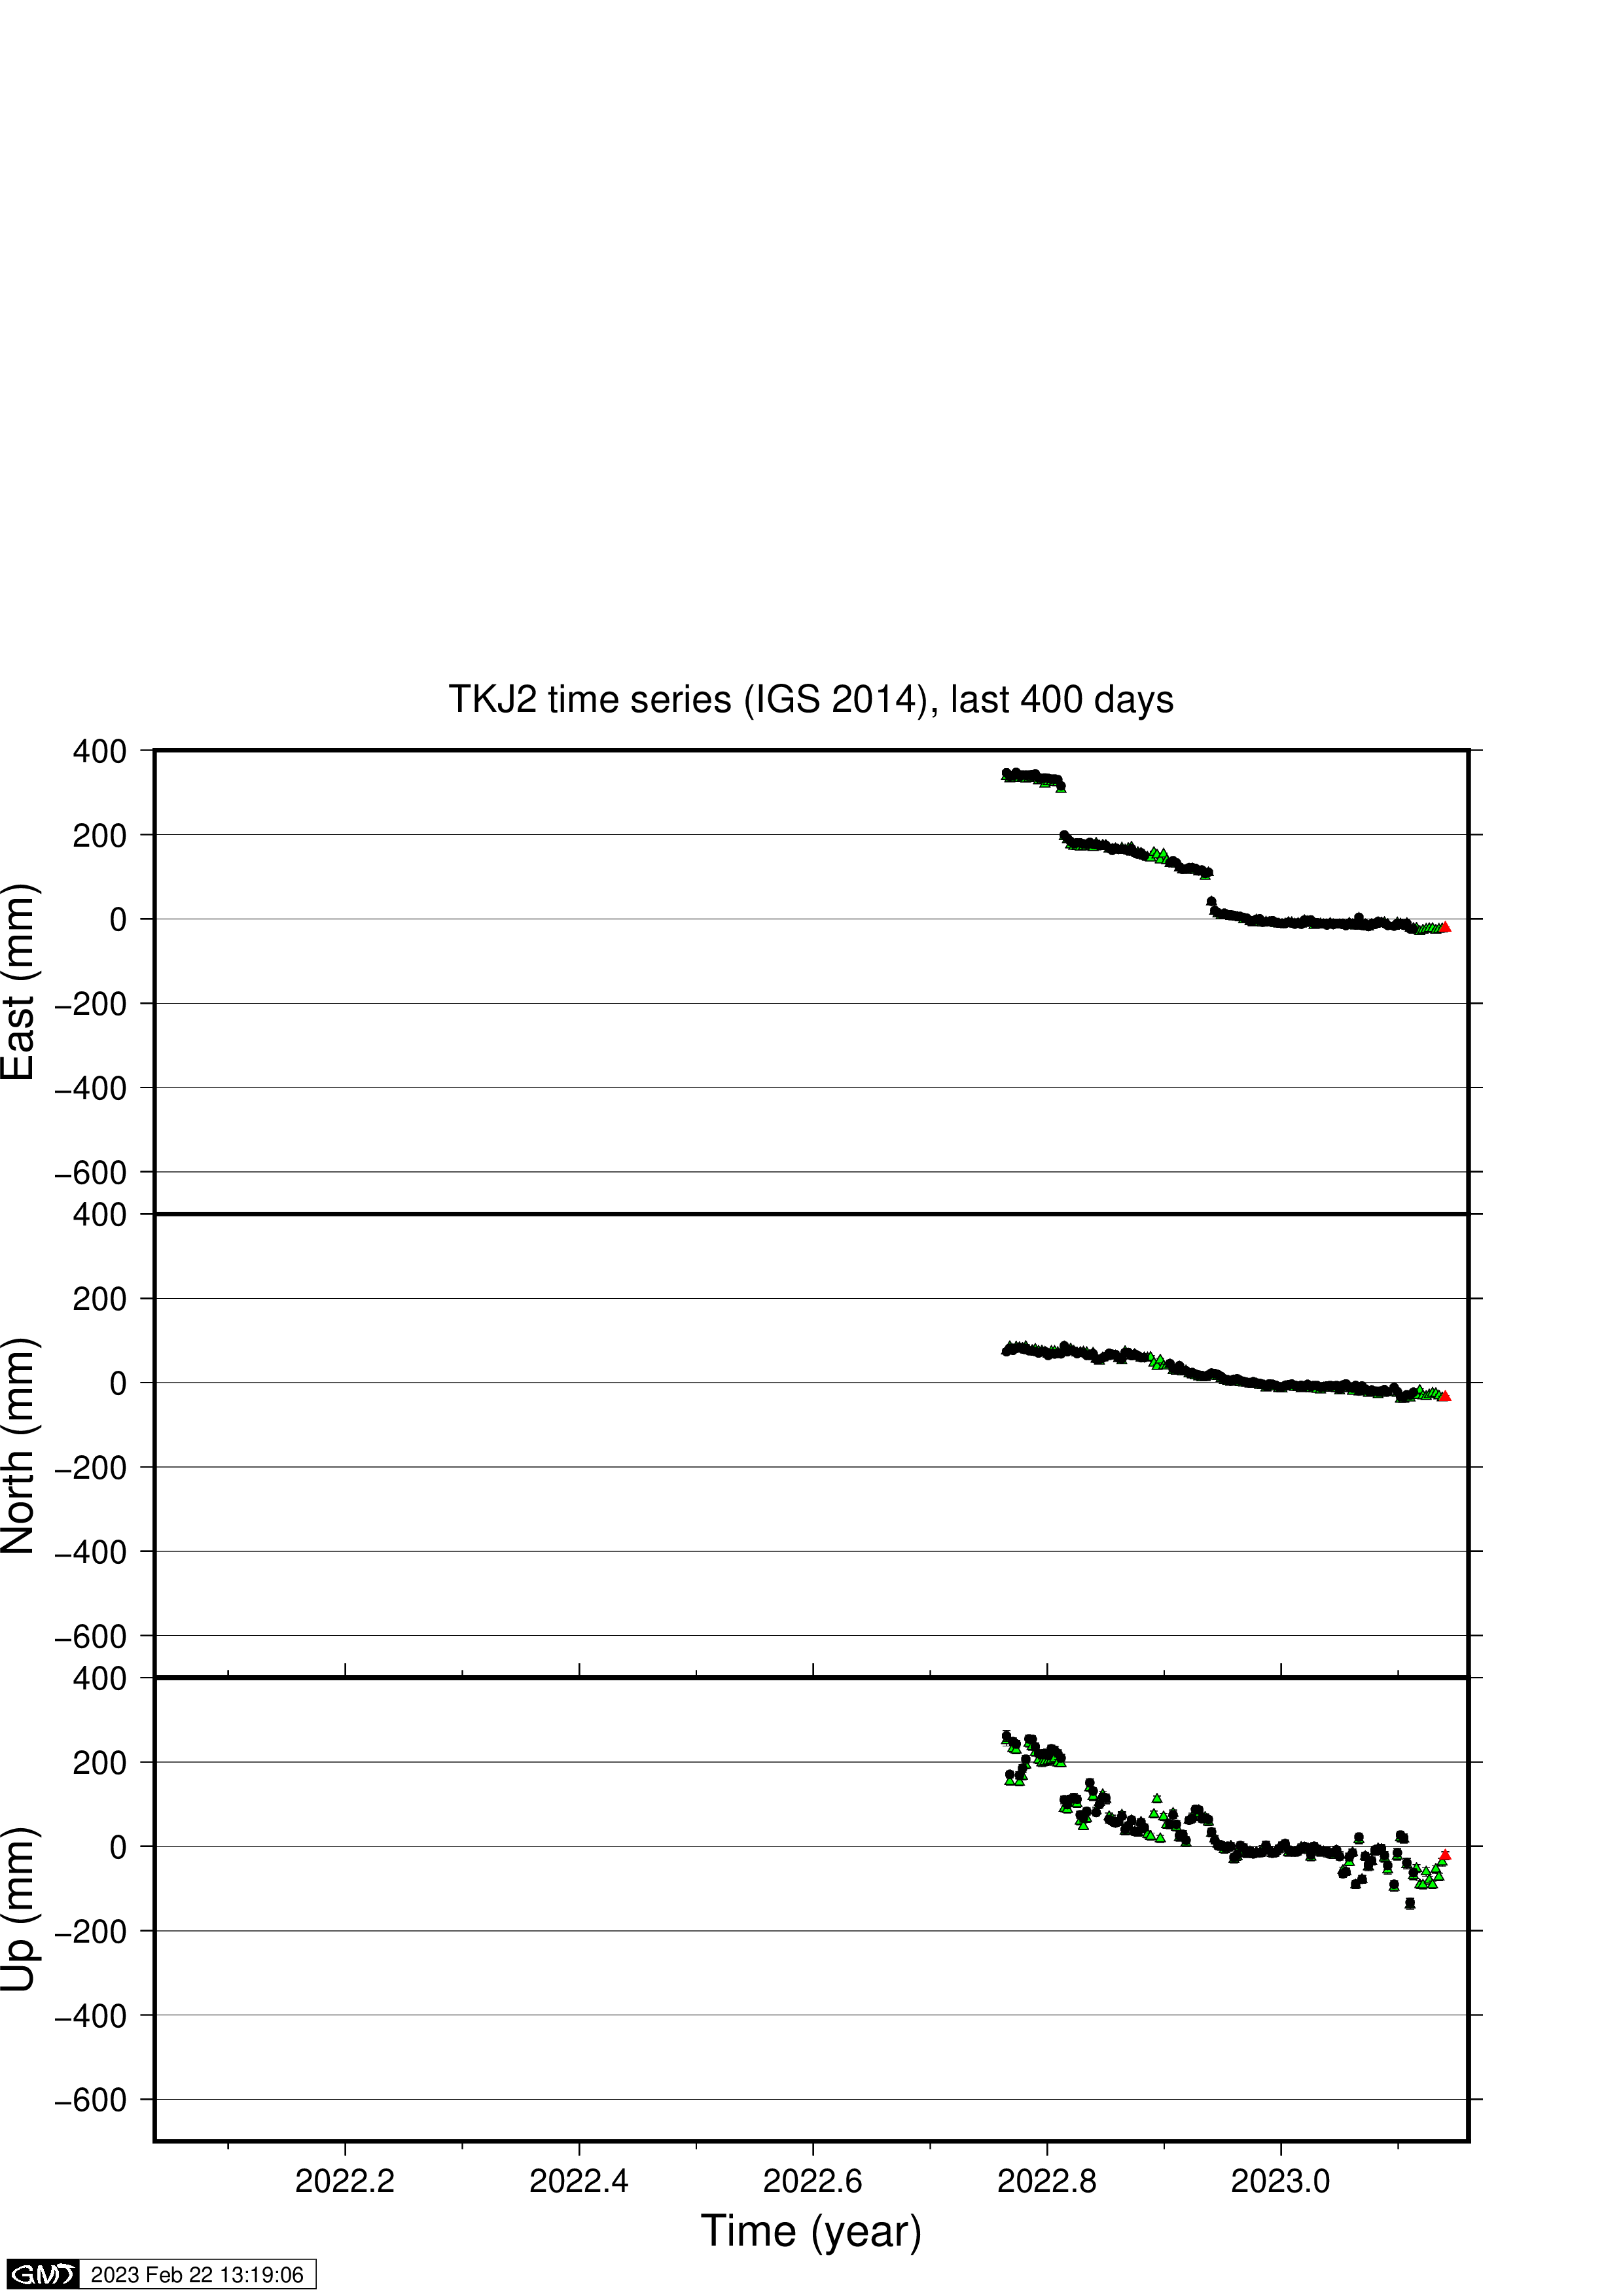

A note about quality of results: The stations are located under a steep slope and therefore suffer somewhat less precision and some irregular periods of erratic position results than typical GNSS stations mainly because of reflections of satellite signals. The 100-day plot contains data from data processing using preliminary satellite orbits (green and red points) and final satellite orbits (black dots). Successfully processed results from yesterday are plotted as a red dot on the 100-day graphs. The velocity map shows the direction and amplitude of motion averaged over some different periods indicated by the different colors: horizontal movement in blue to red colors and vertical movement in gray to black colors. All results are automatically generated and not reviewed by anyone before presented here (beware of data errors).
Some other websites with GNSS time series:
Time series plots for the last 100 days, all cGPS sites in Iceland, GIPSY processing
Time series plots for the last 400 days, all cGPS sites in Iceland, GIPSY processing
Final Time series:
Final time series including all outliers and offsets (uncorrected)
Final time series
Residual time series
Final time series (some large events removed)
Residual (linear signal removed) time series (some large events removed)
Residual (linear and seasonal signals removed) time series (linear and seasonal signals removed, some large events removed as above)
Fit of seasonal signal
Other plots:
Combined plots for specific areas
Kinematic solutions: Hekla, Katla, SISZ, Other stations
Qc plots Site voltage plots
Halldór Geirsson, University of Iceland.