
| GNSS time series for Oraefajokull |
|---|
|
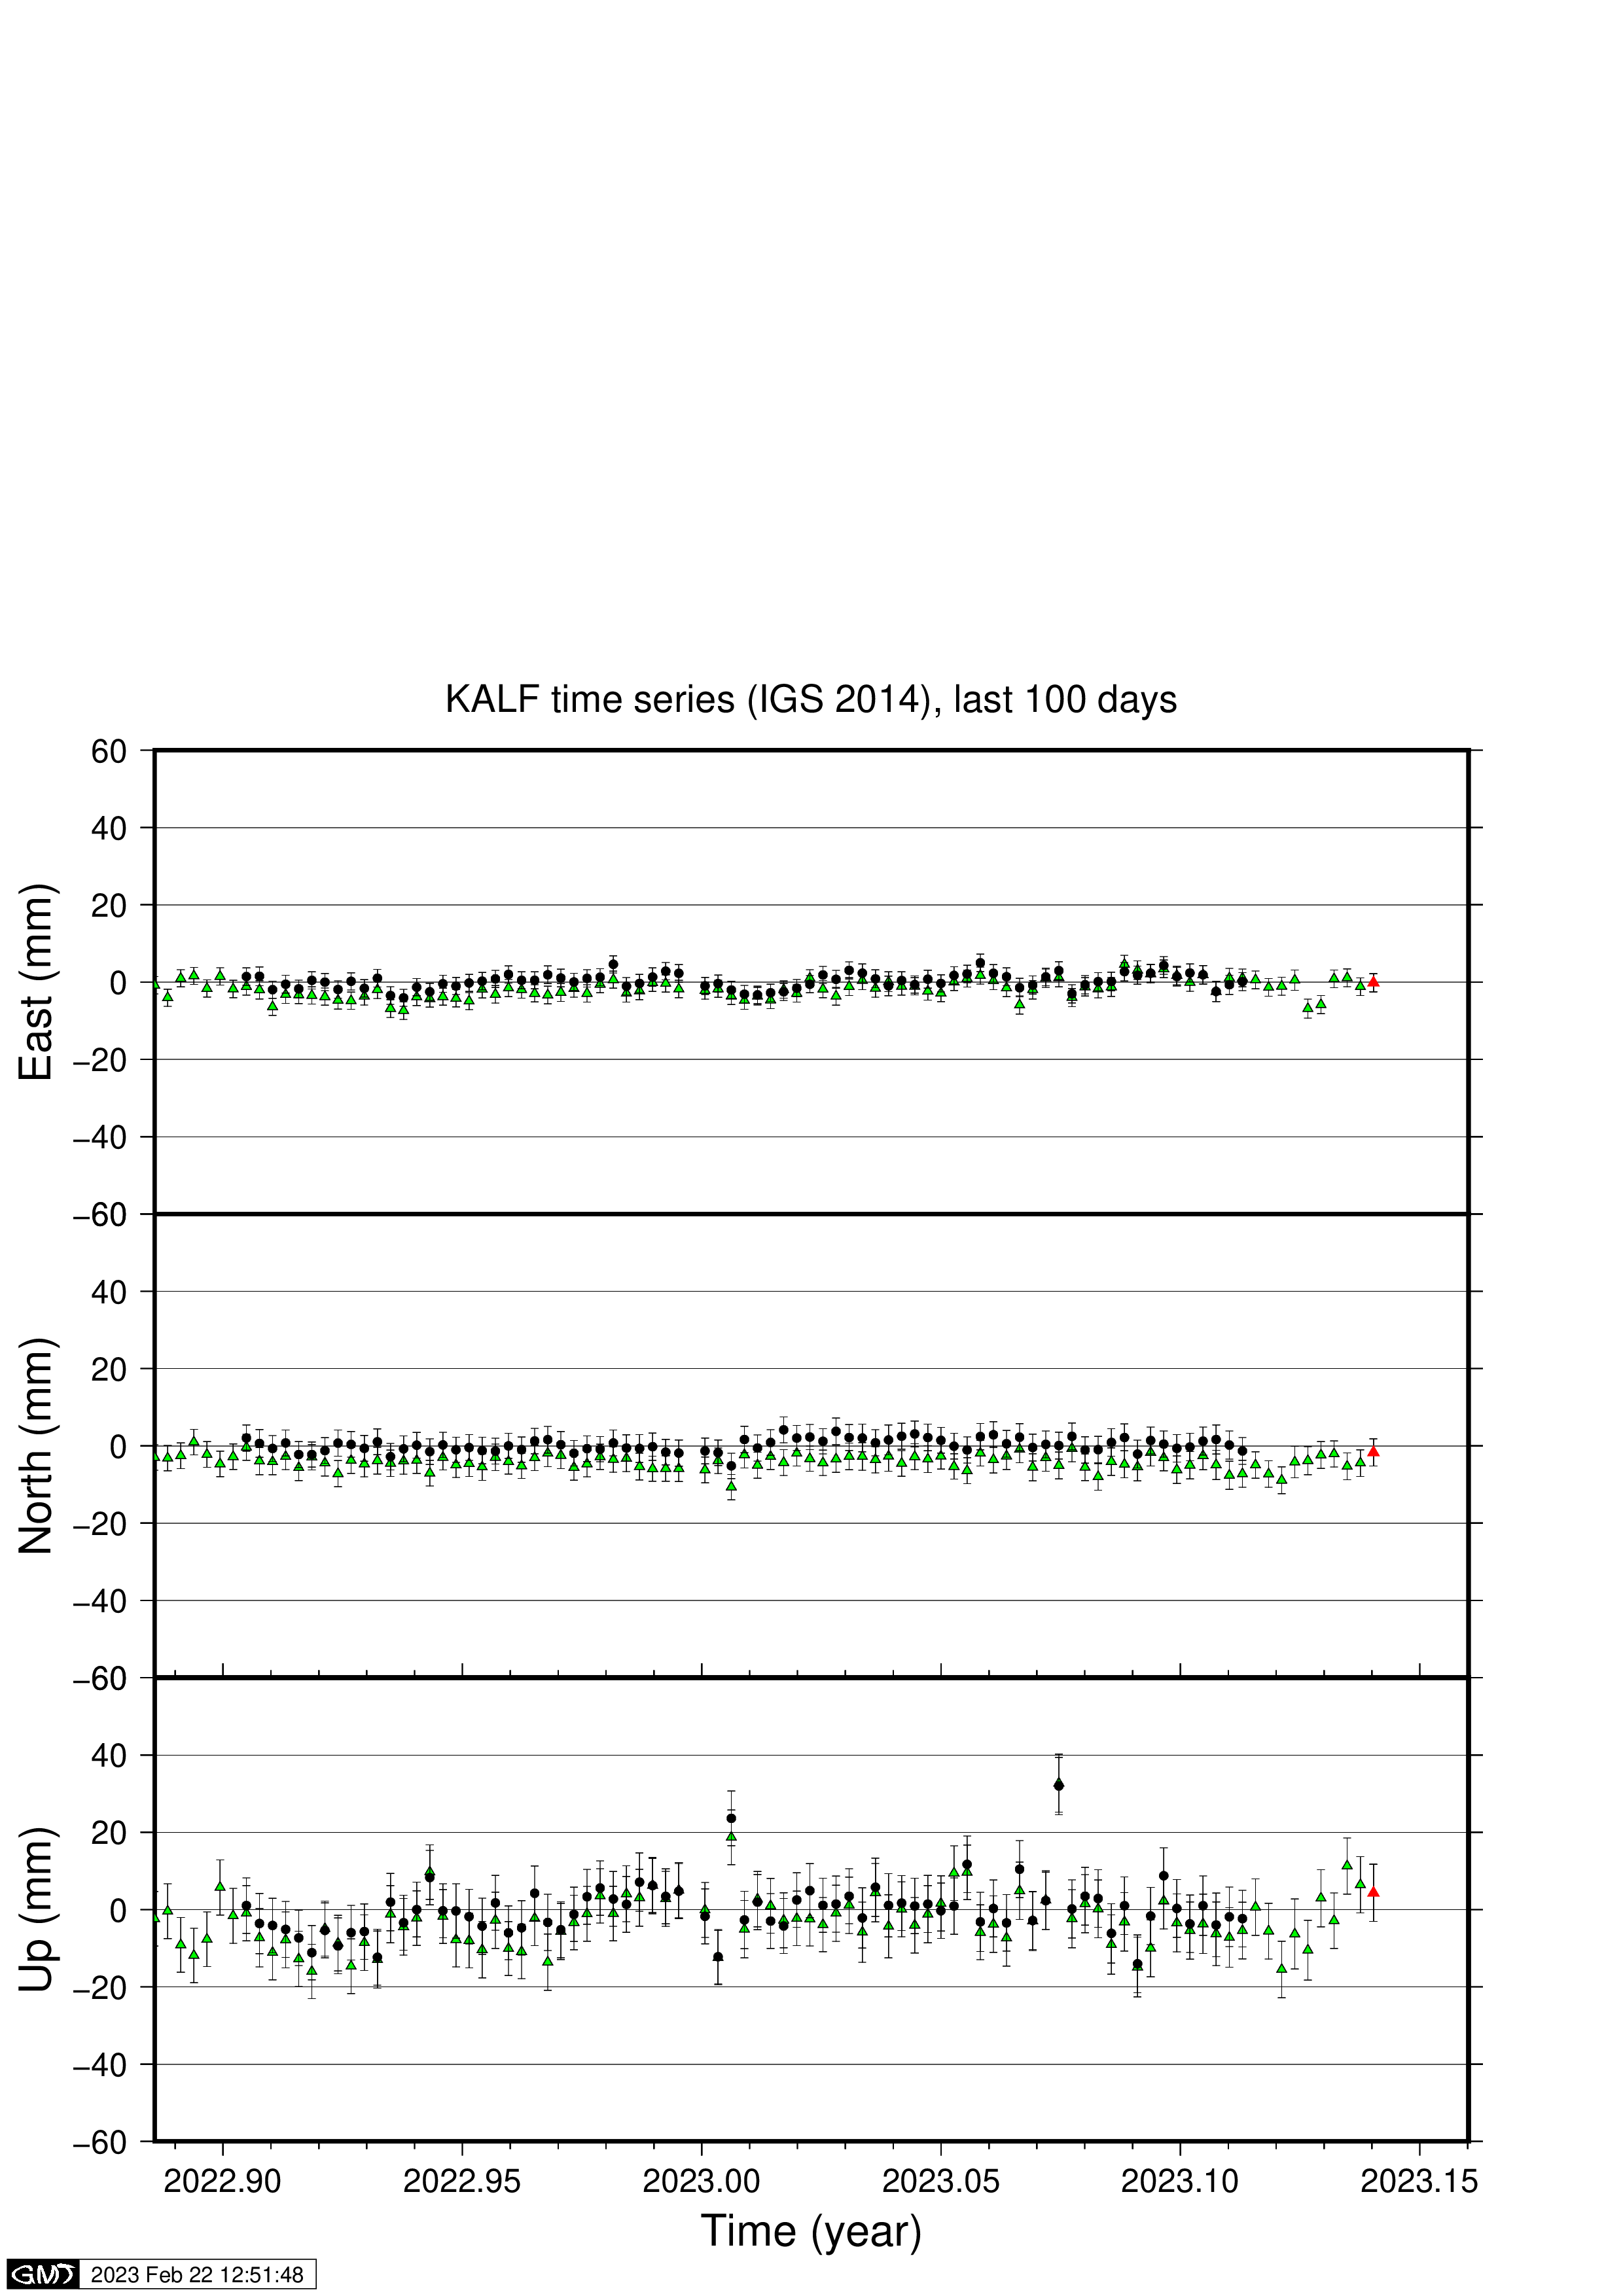
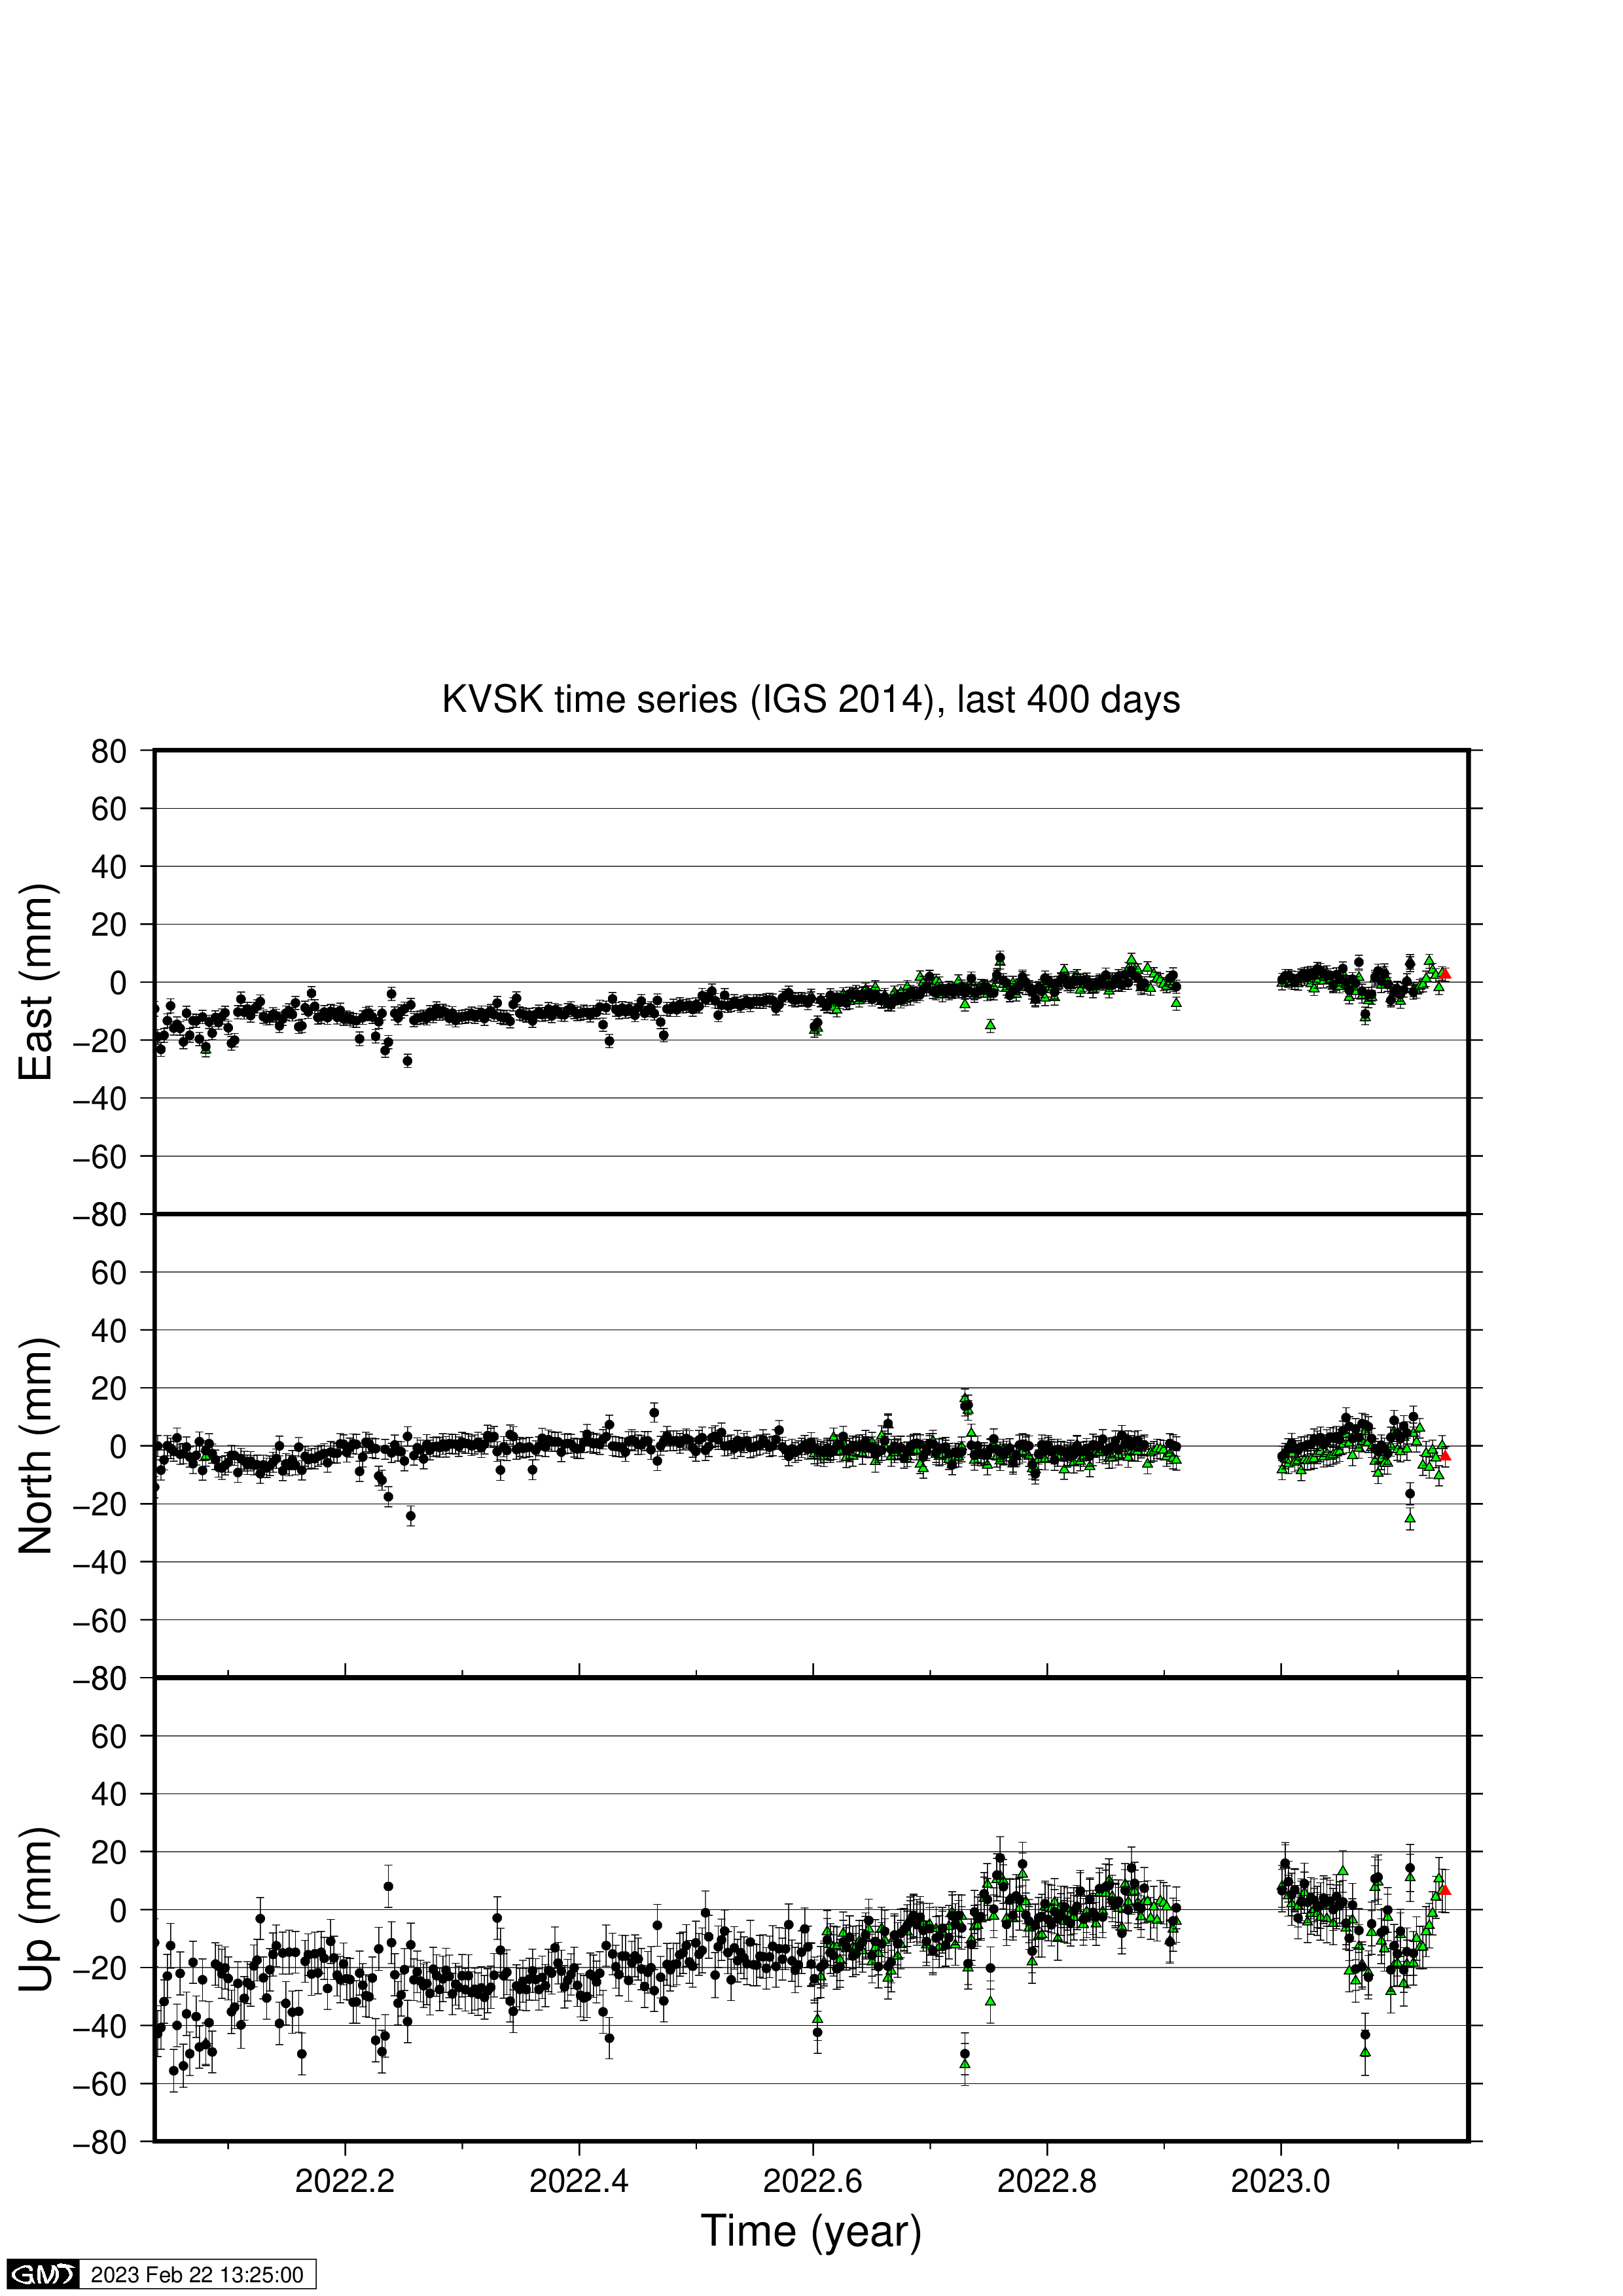
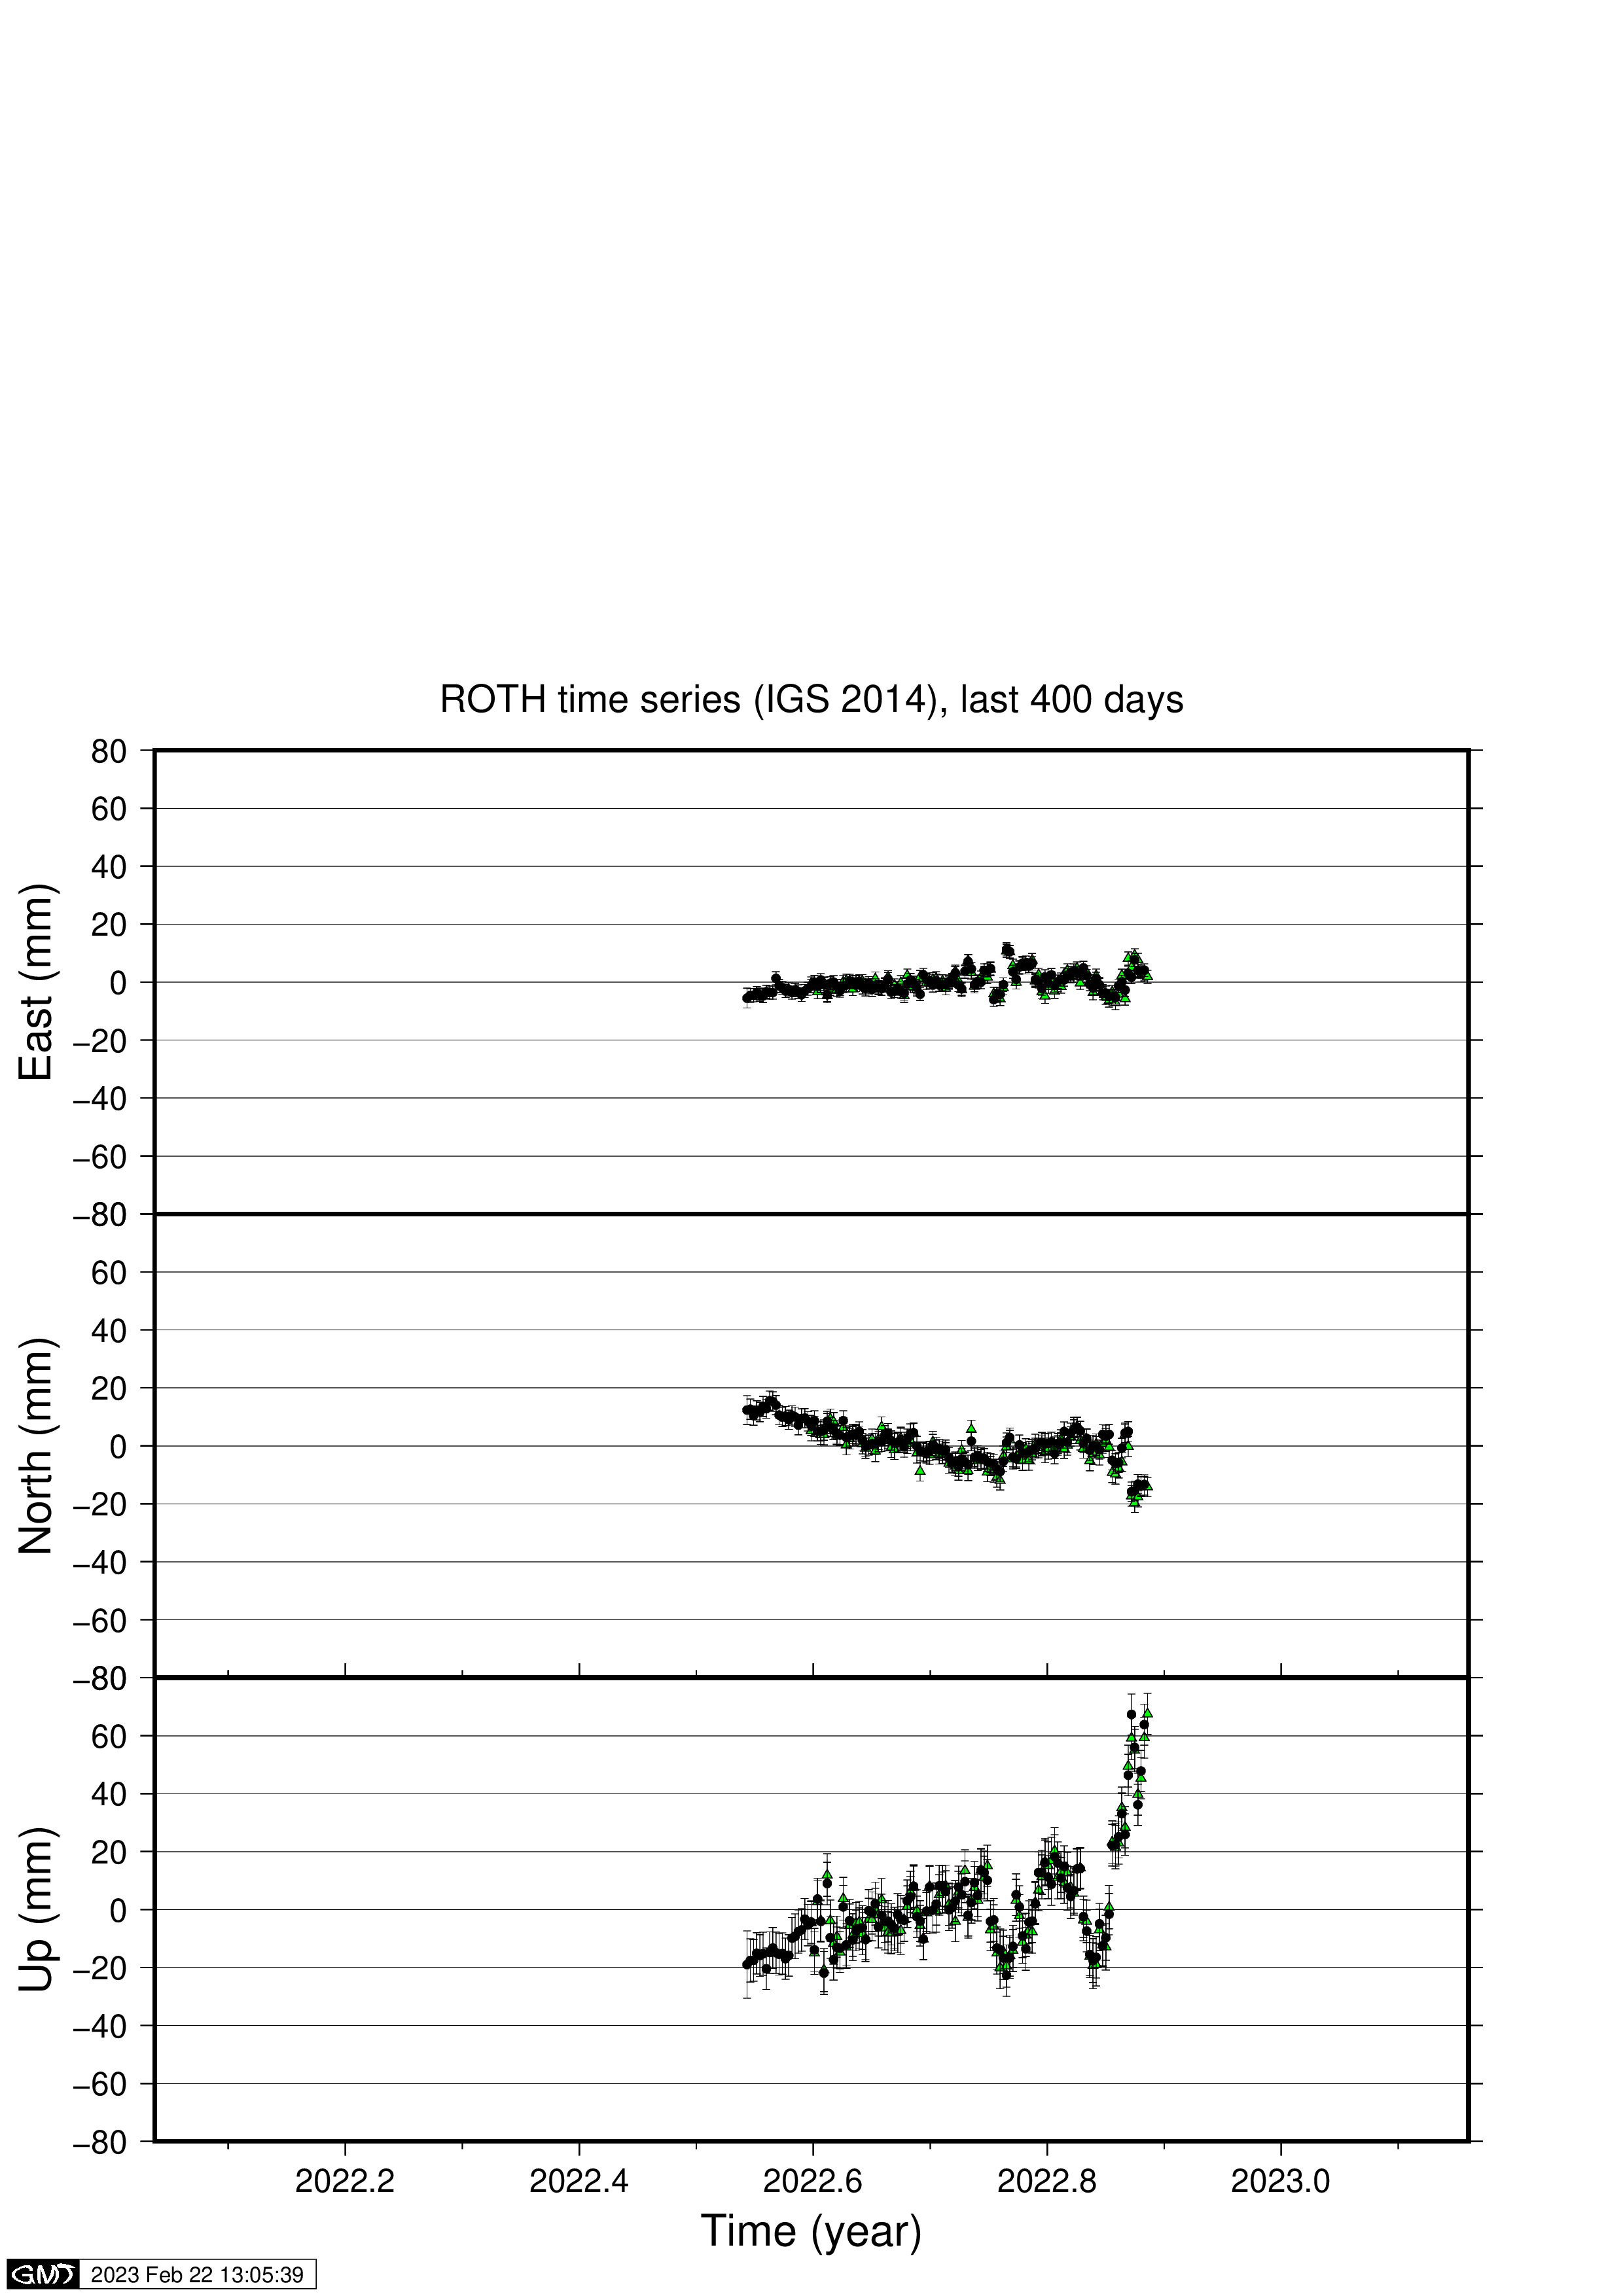
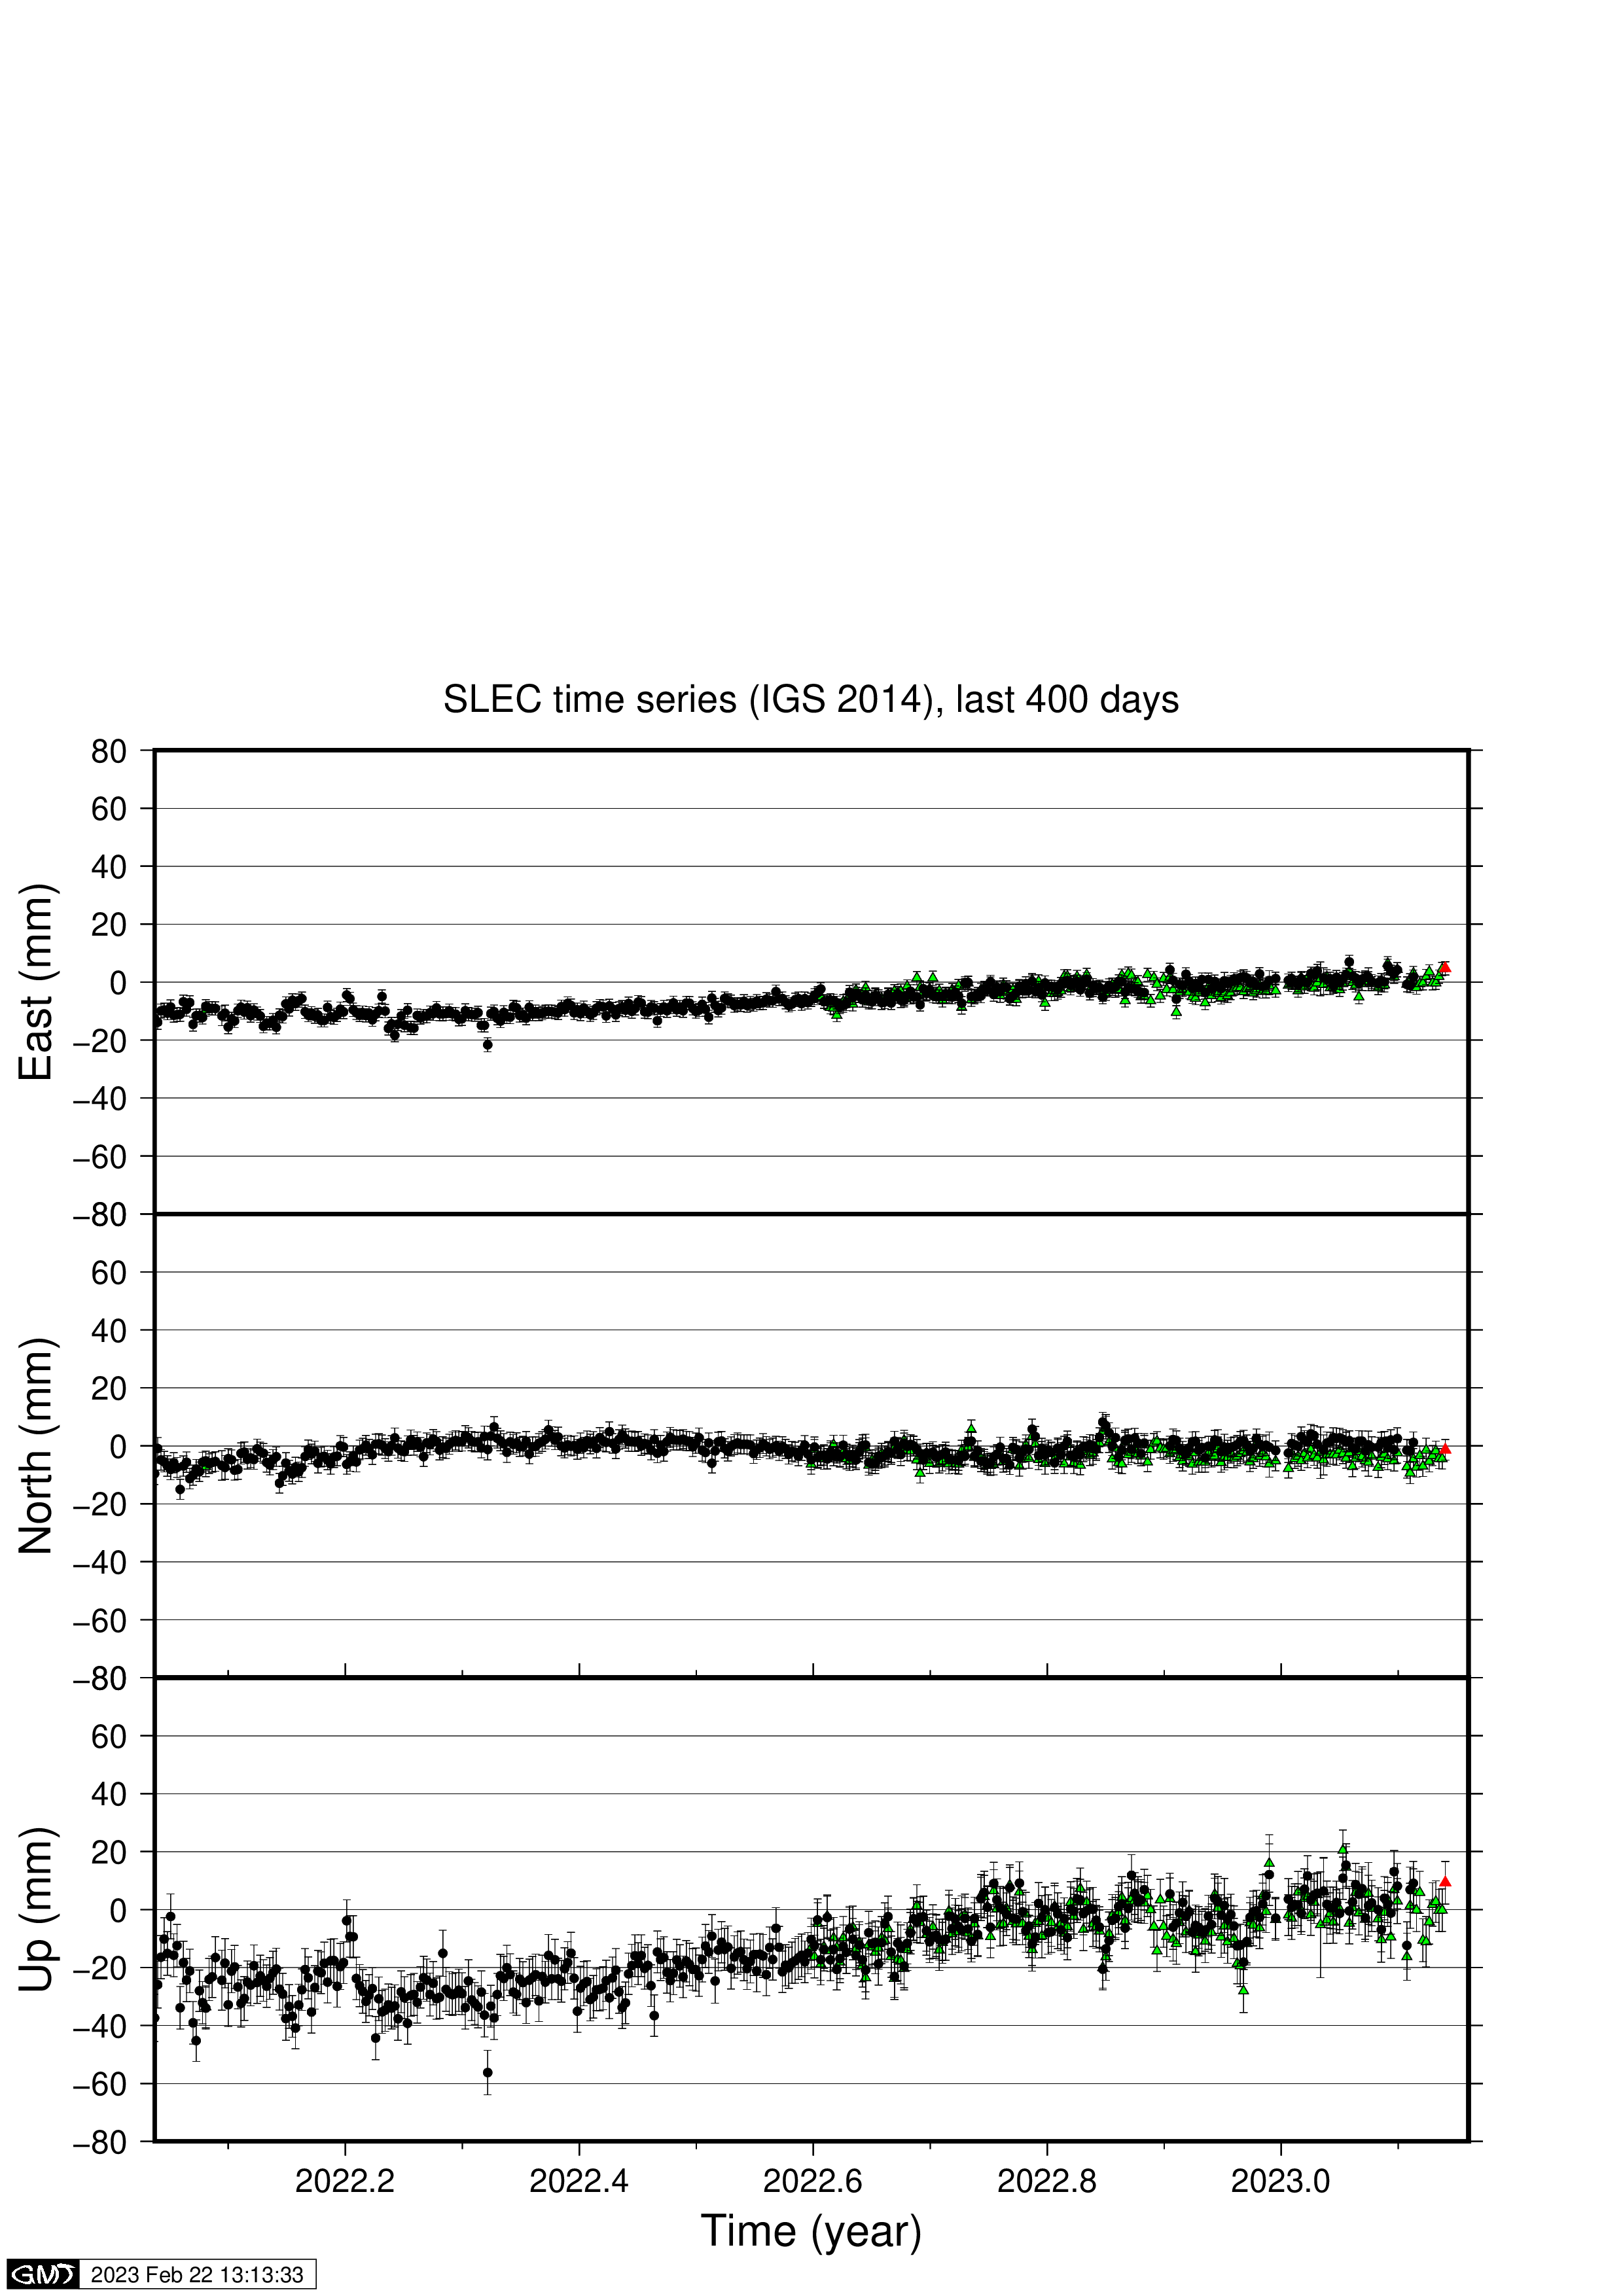
GNSS time series results for the Oraefajokull region from GIPSY/OASIS PPP single site processing.
The images are updated regularly, check date on bottom of figure and refresh page as necessary. Stations are ordred roughly from counter-clockwise around Oraefajokull. Click on any image for a higher-resolution image. Stations are operated by IMO in collaboration with IES and others. Page maintained by Halldor Geirsson, hgeirs **that sign** hi.is Please respect copyright of the results. Last 100 days Last 400 days Kinematic results Final time series, ITRF2008 Final time series, detrended Final time series, detrended and seasonal signal removed Estimation of seasonal signal | 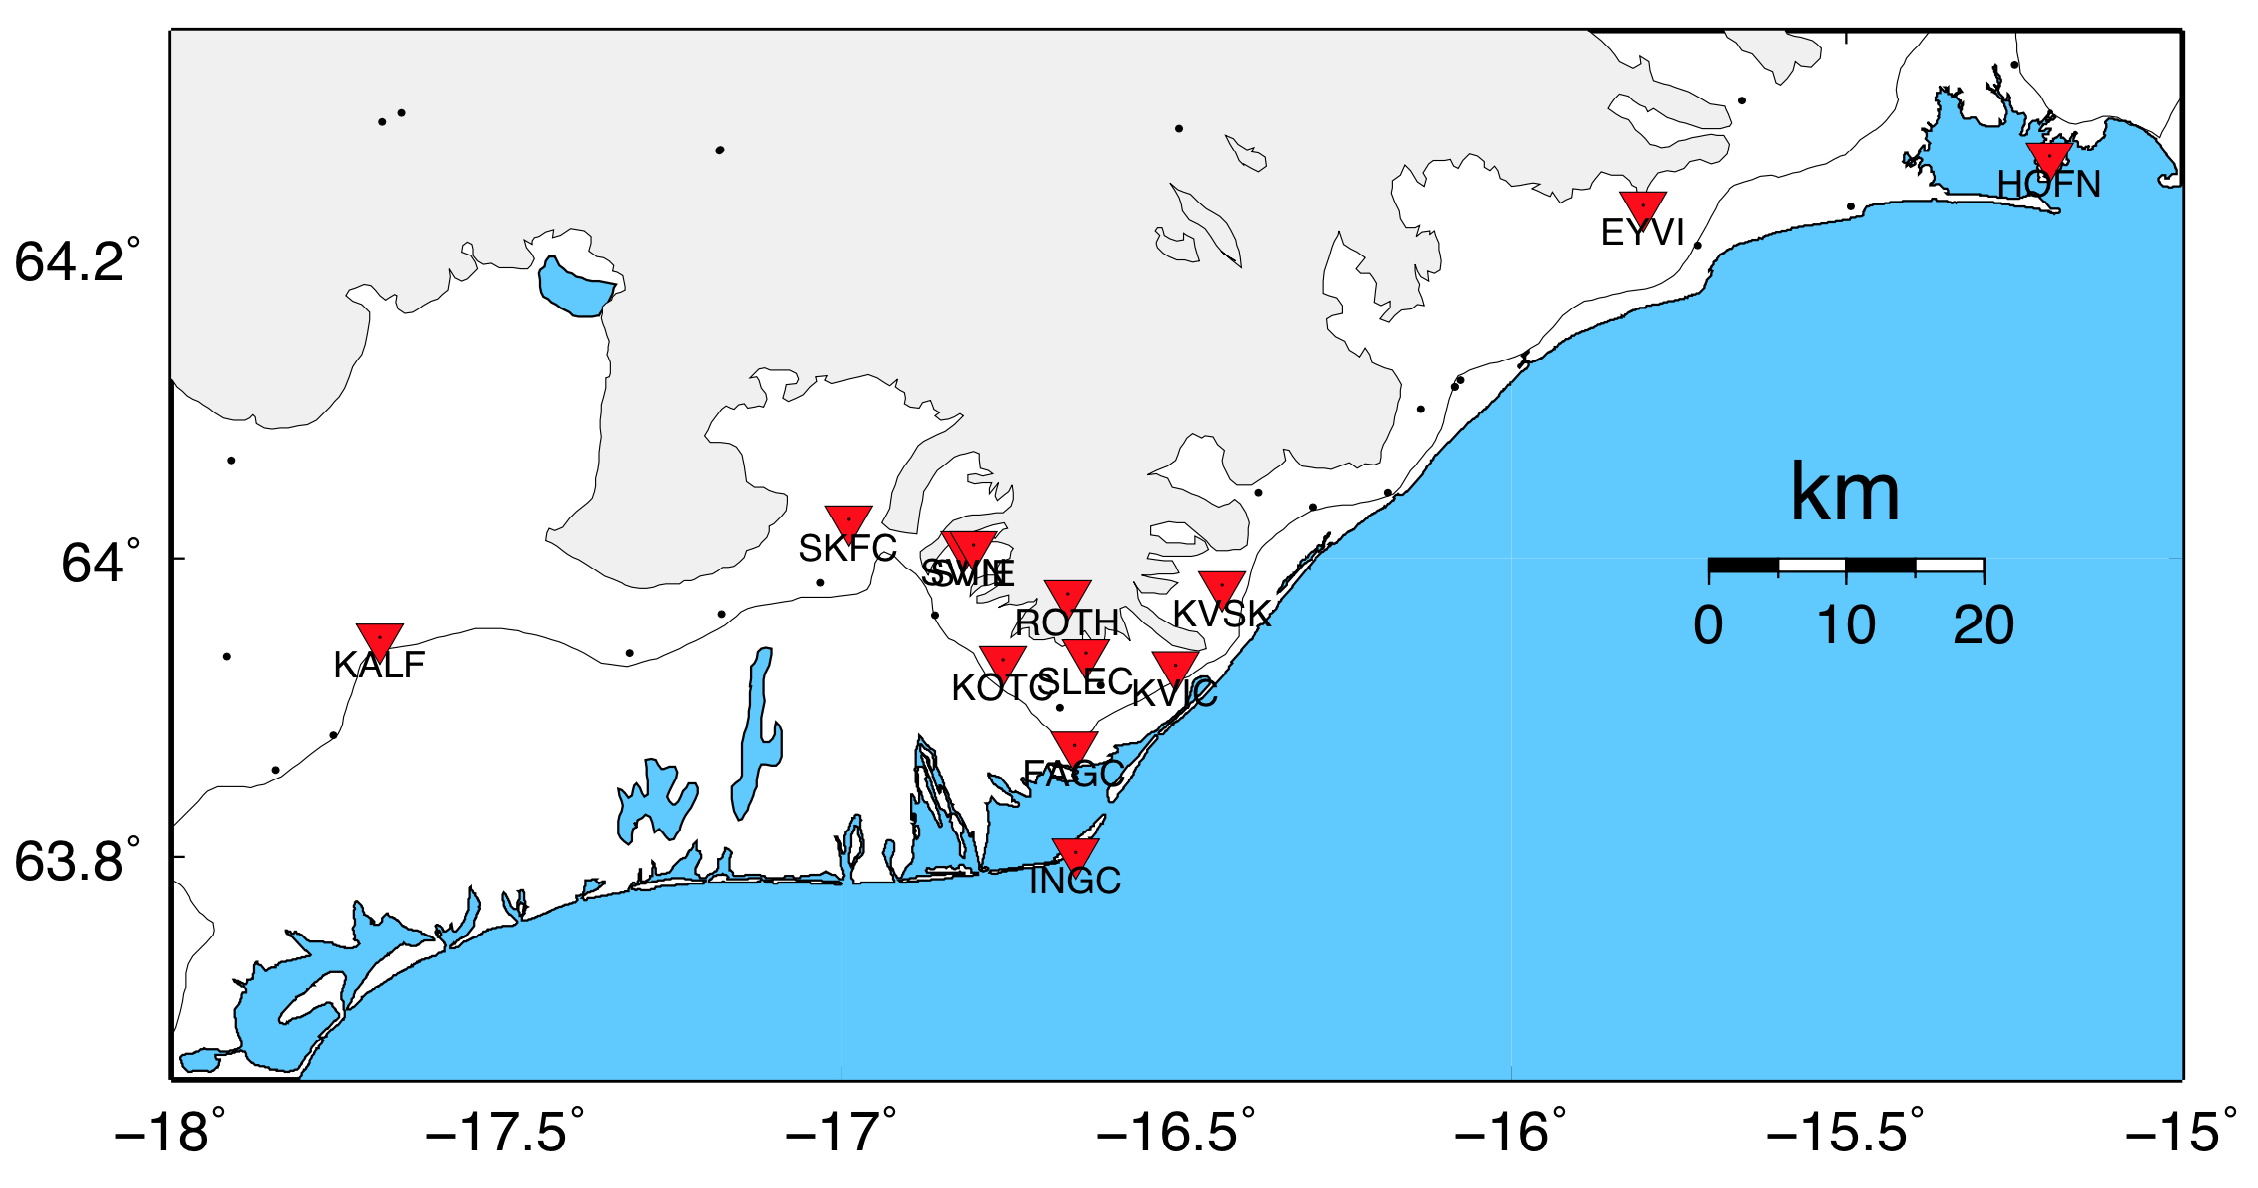
|
|---|
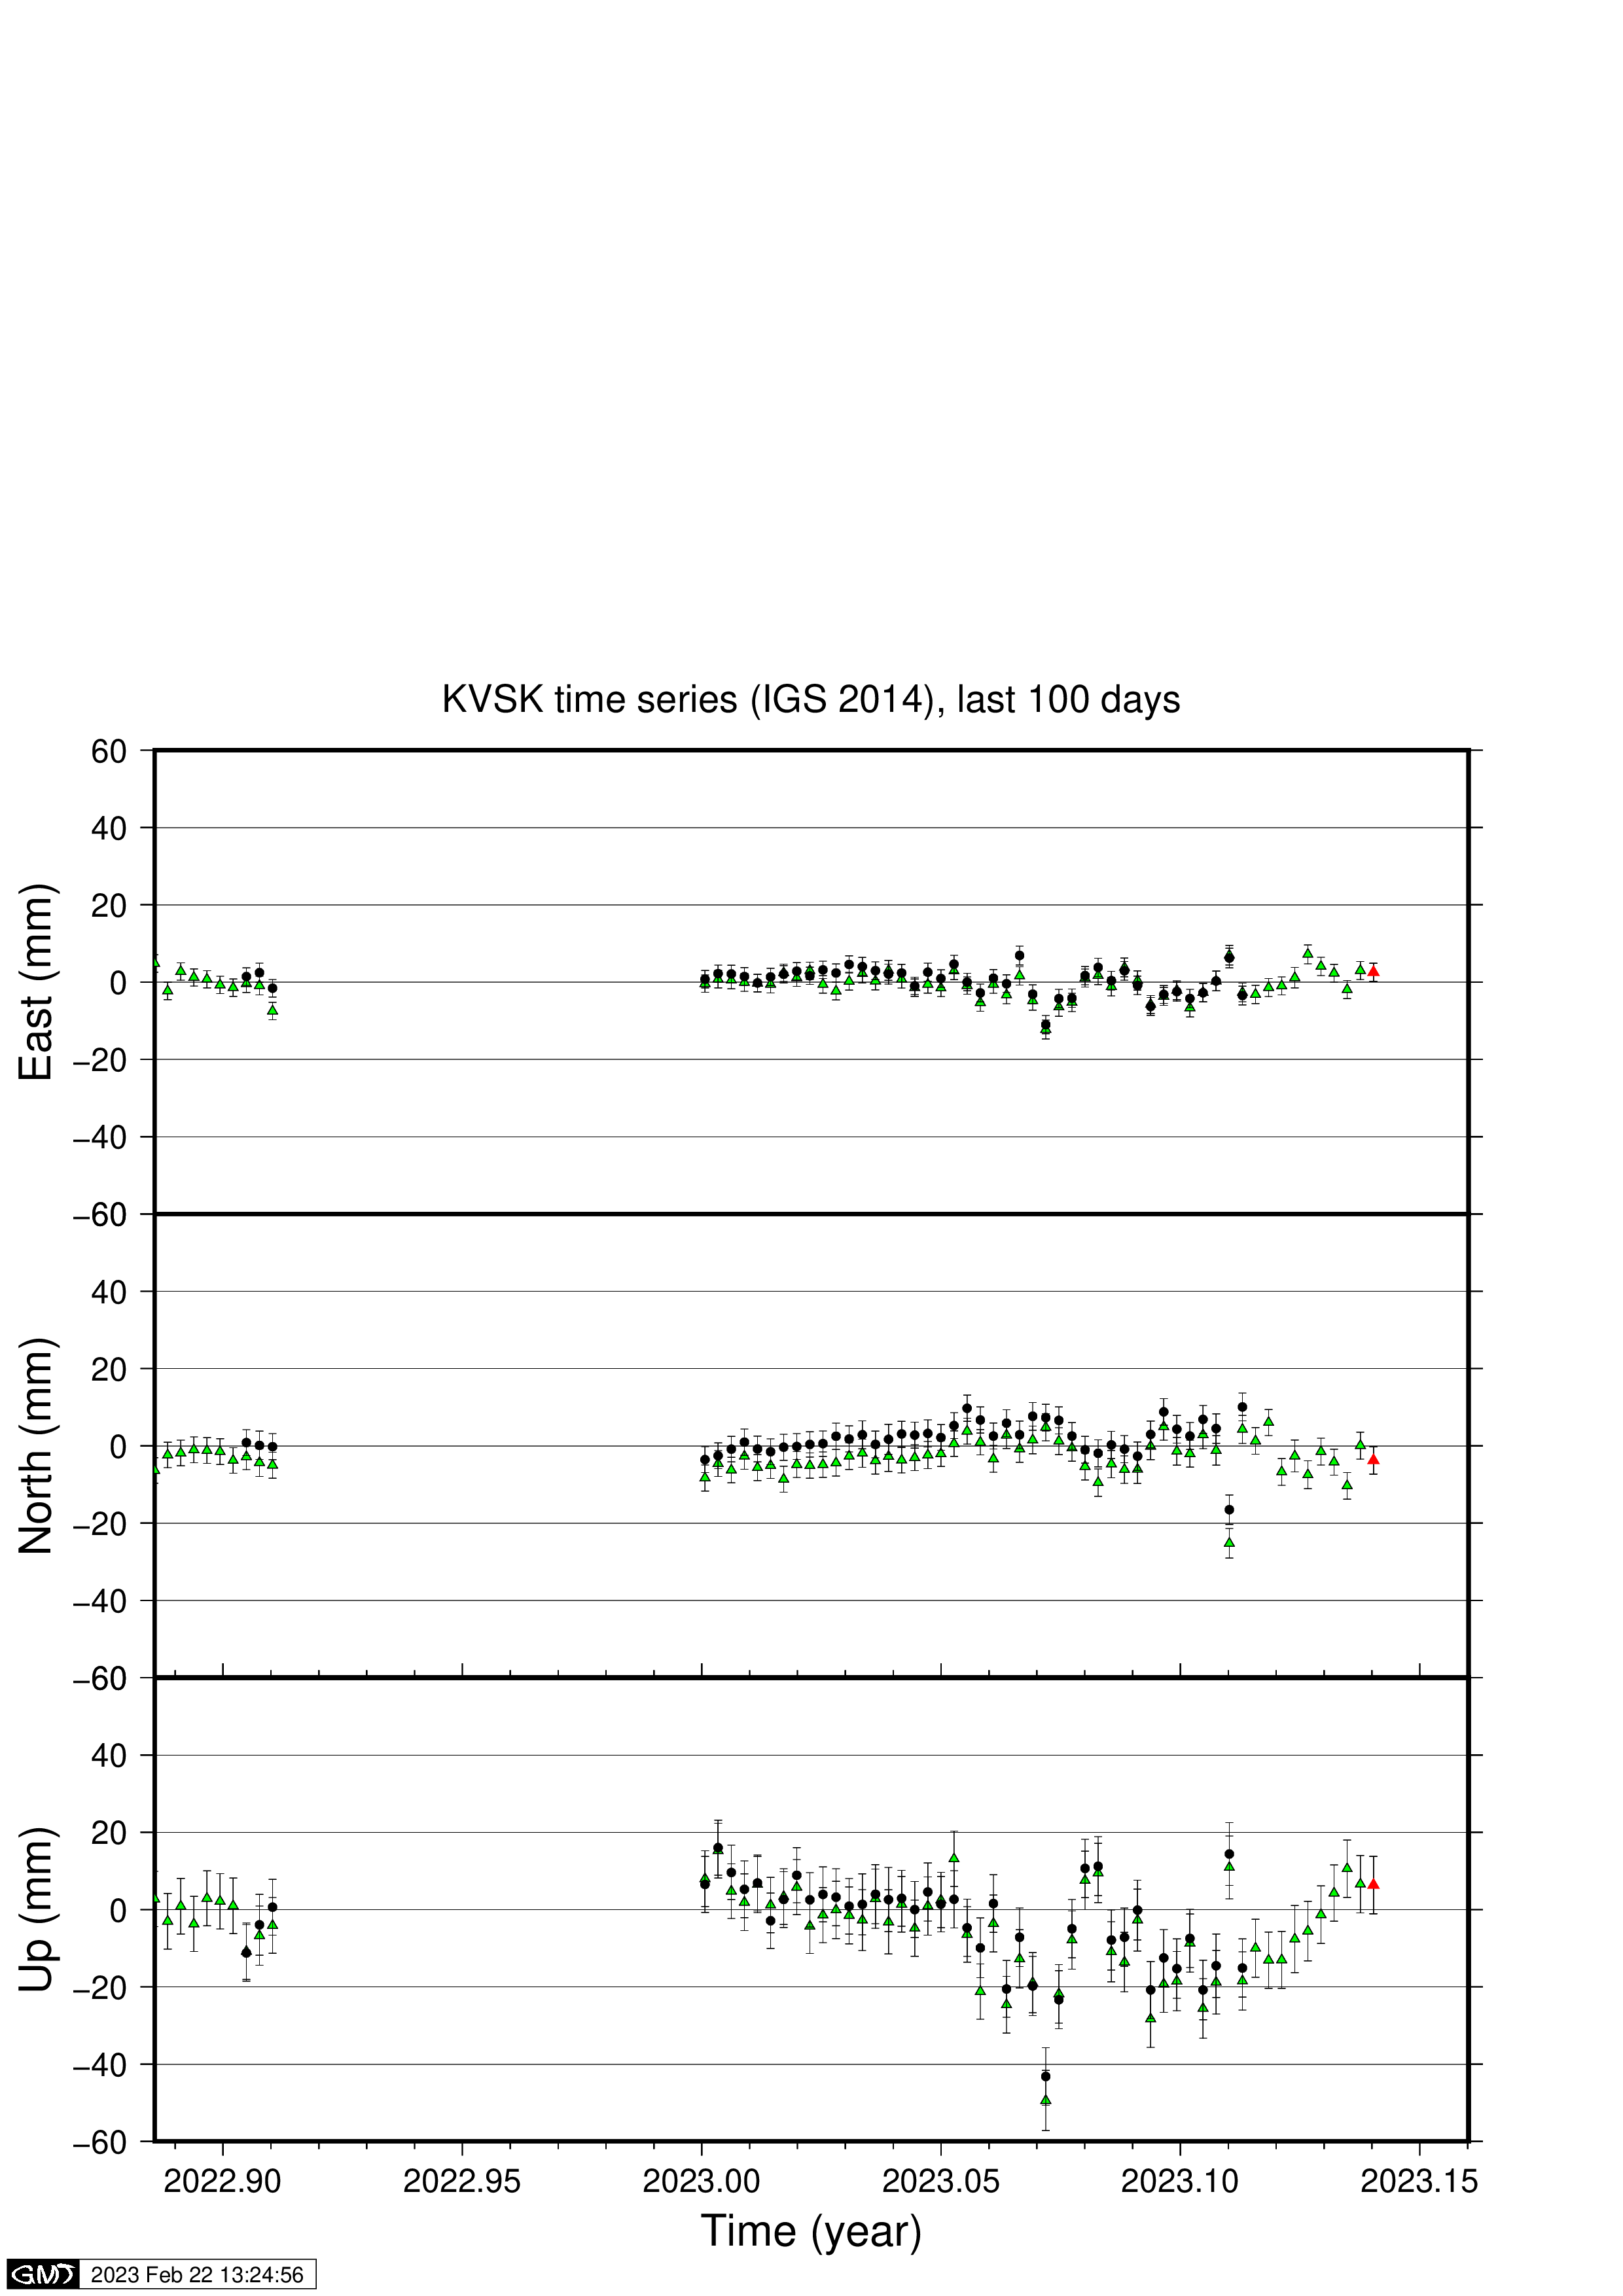
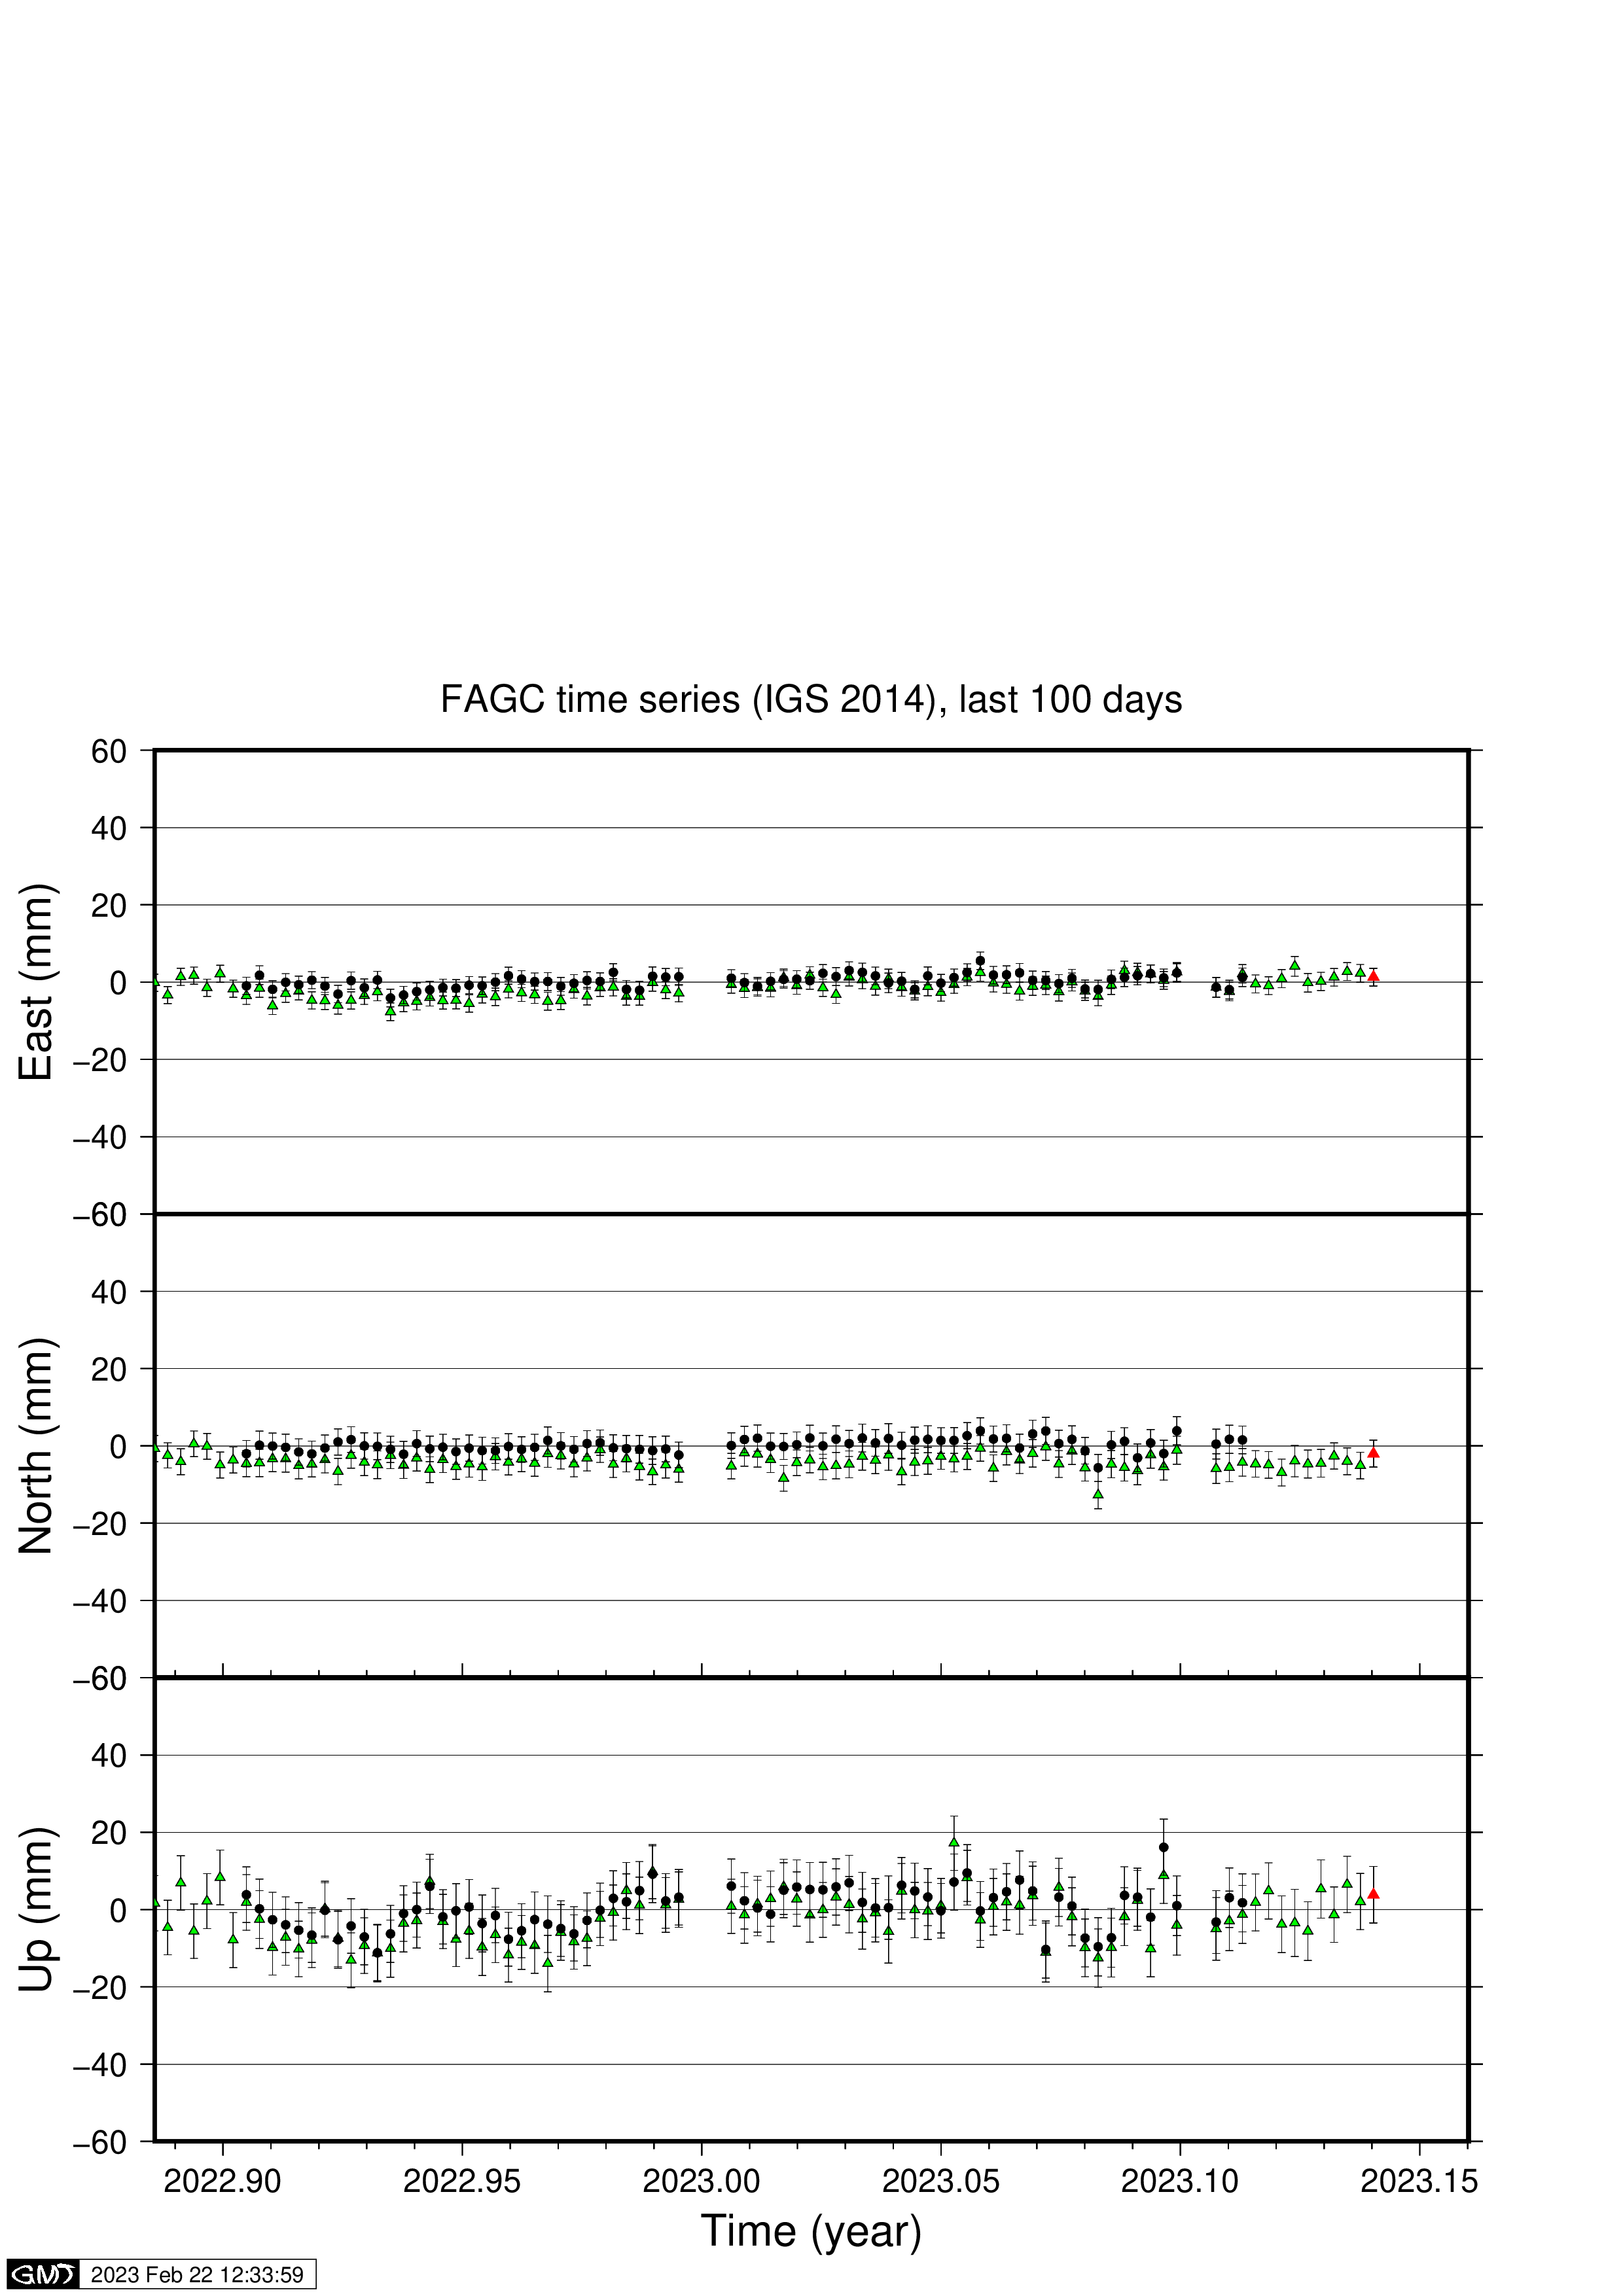
Last 100 days


To top of page
Last 400 days
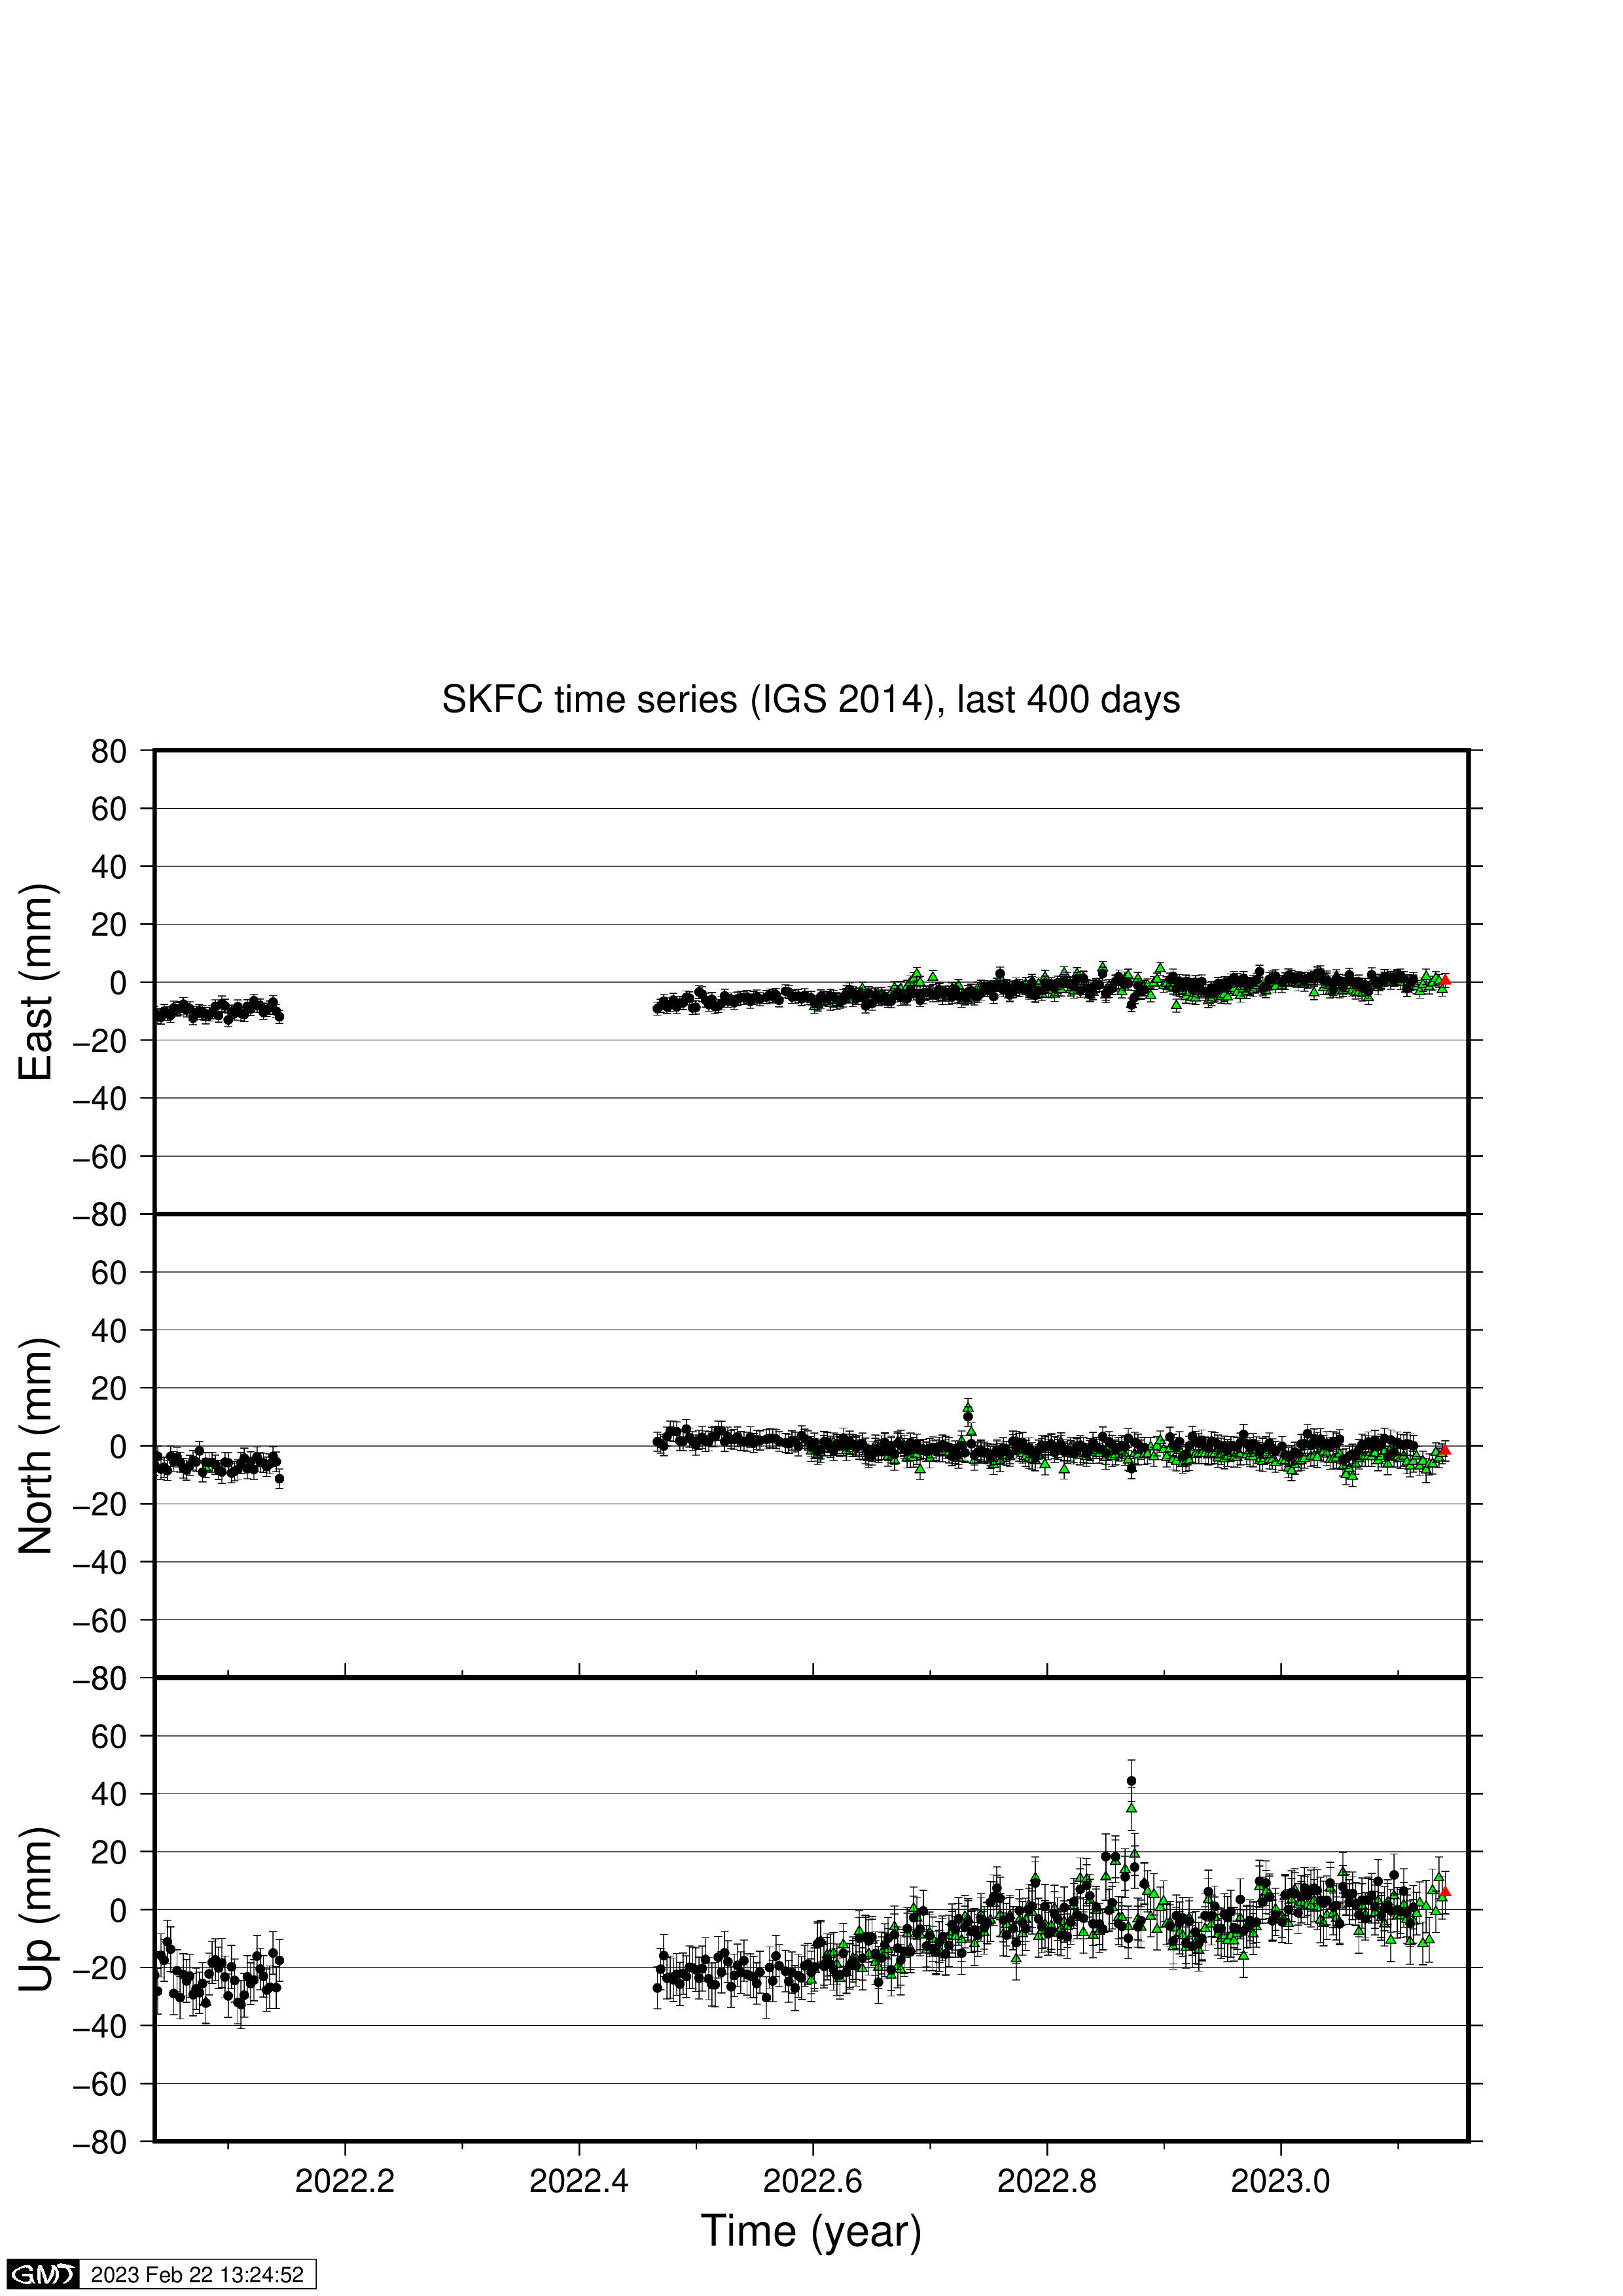
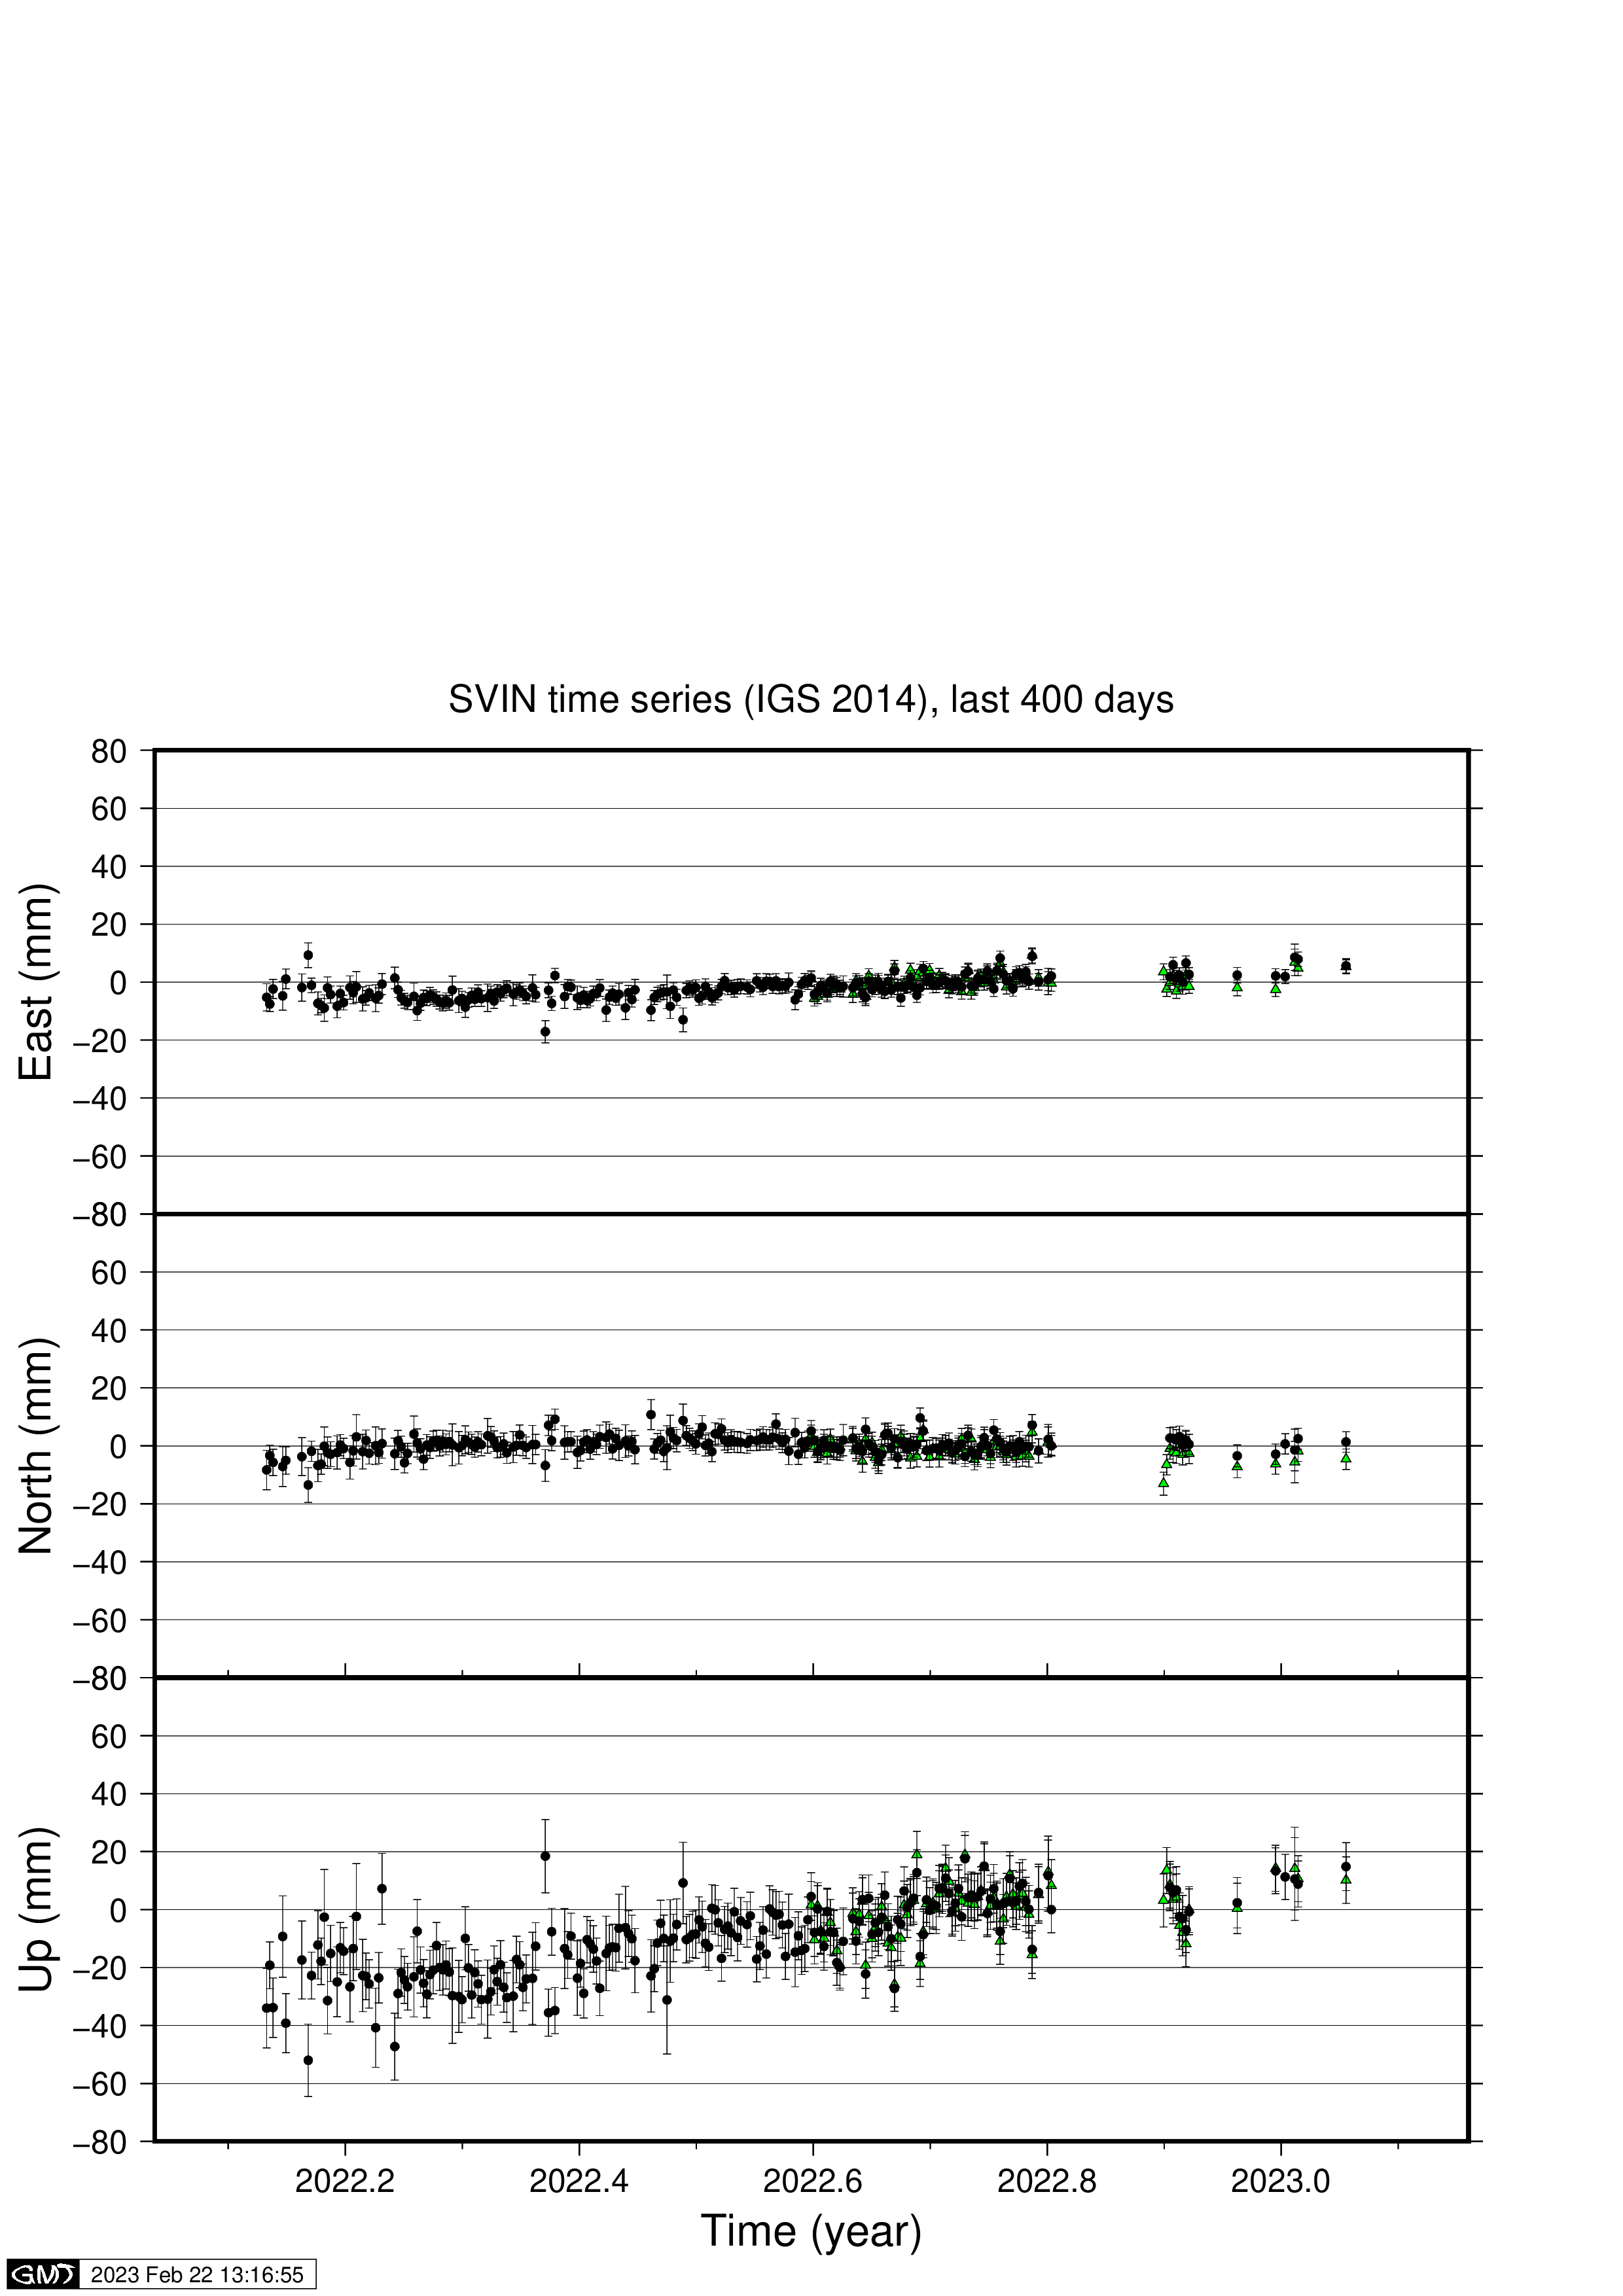
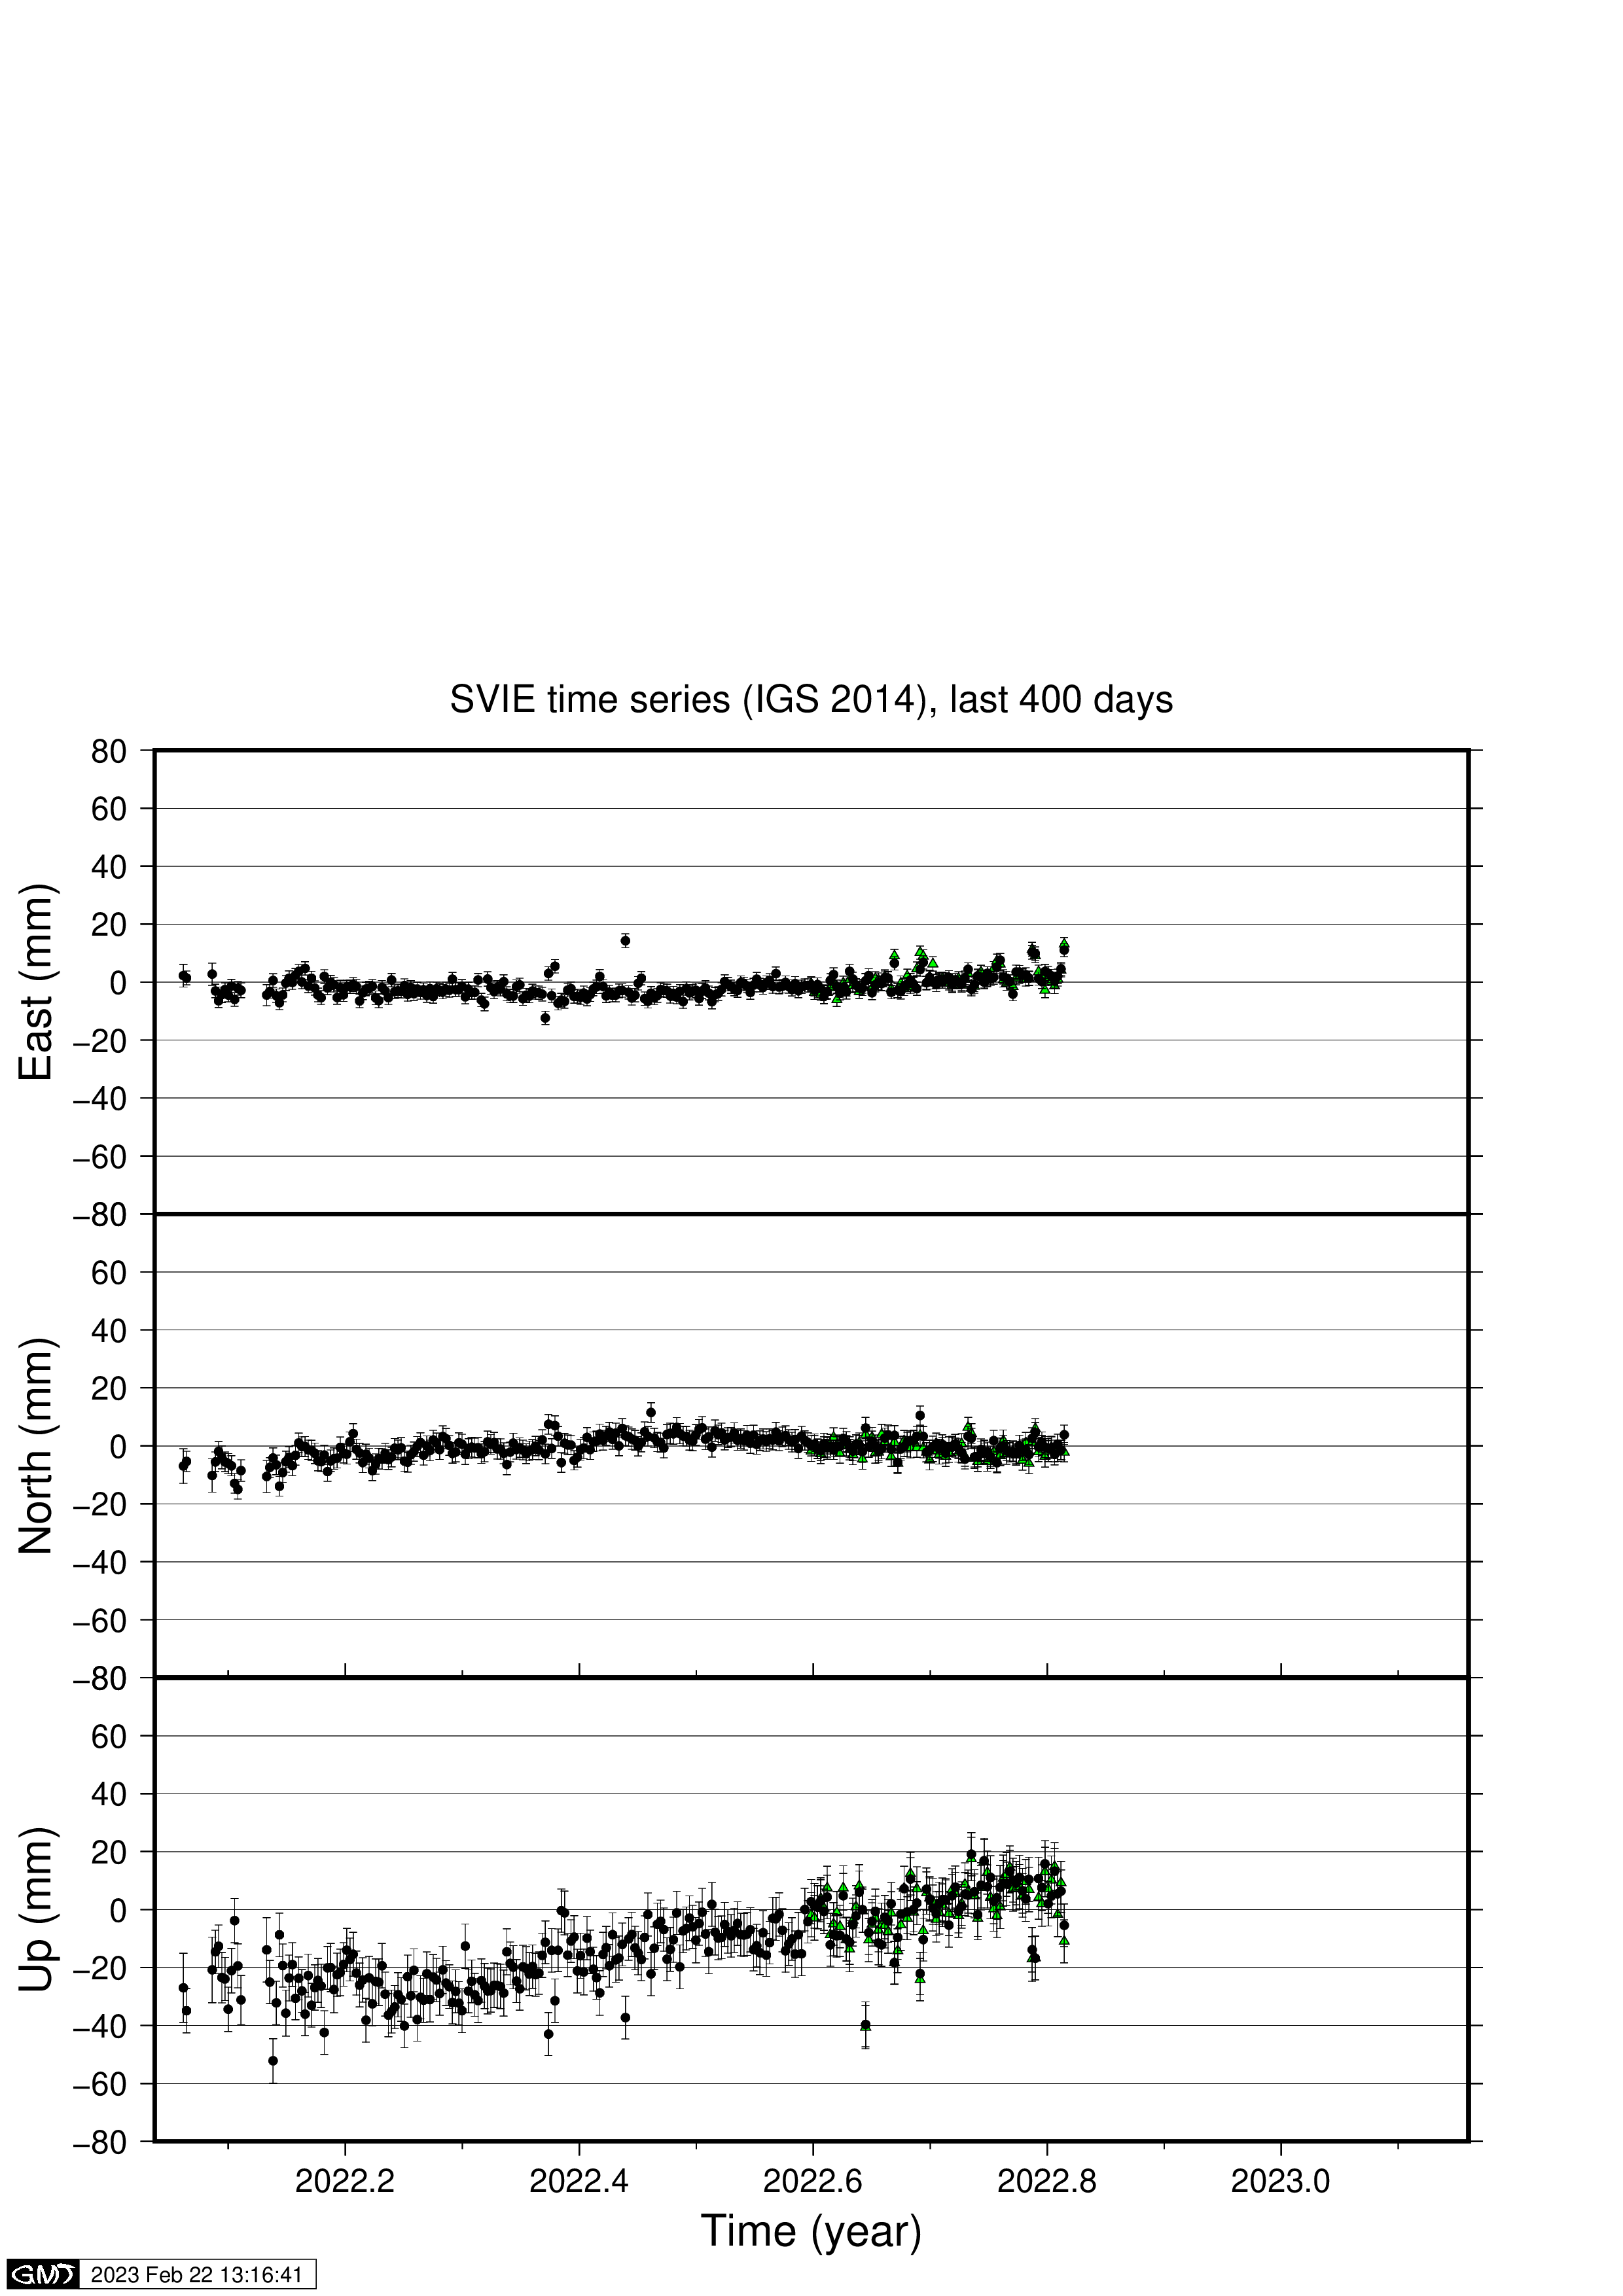
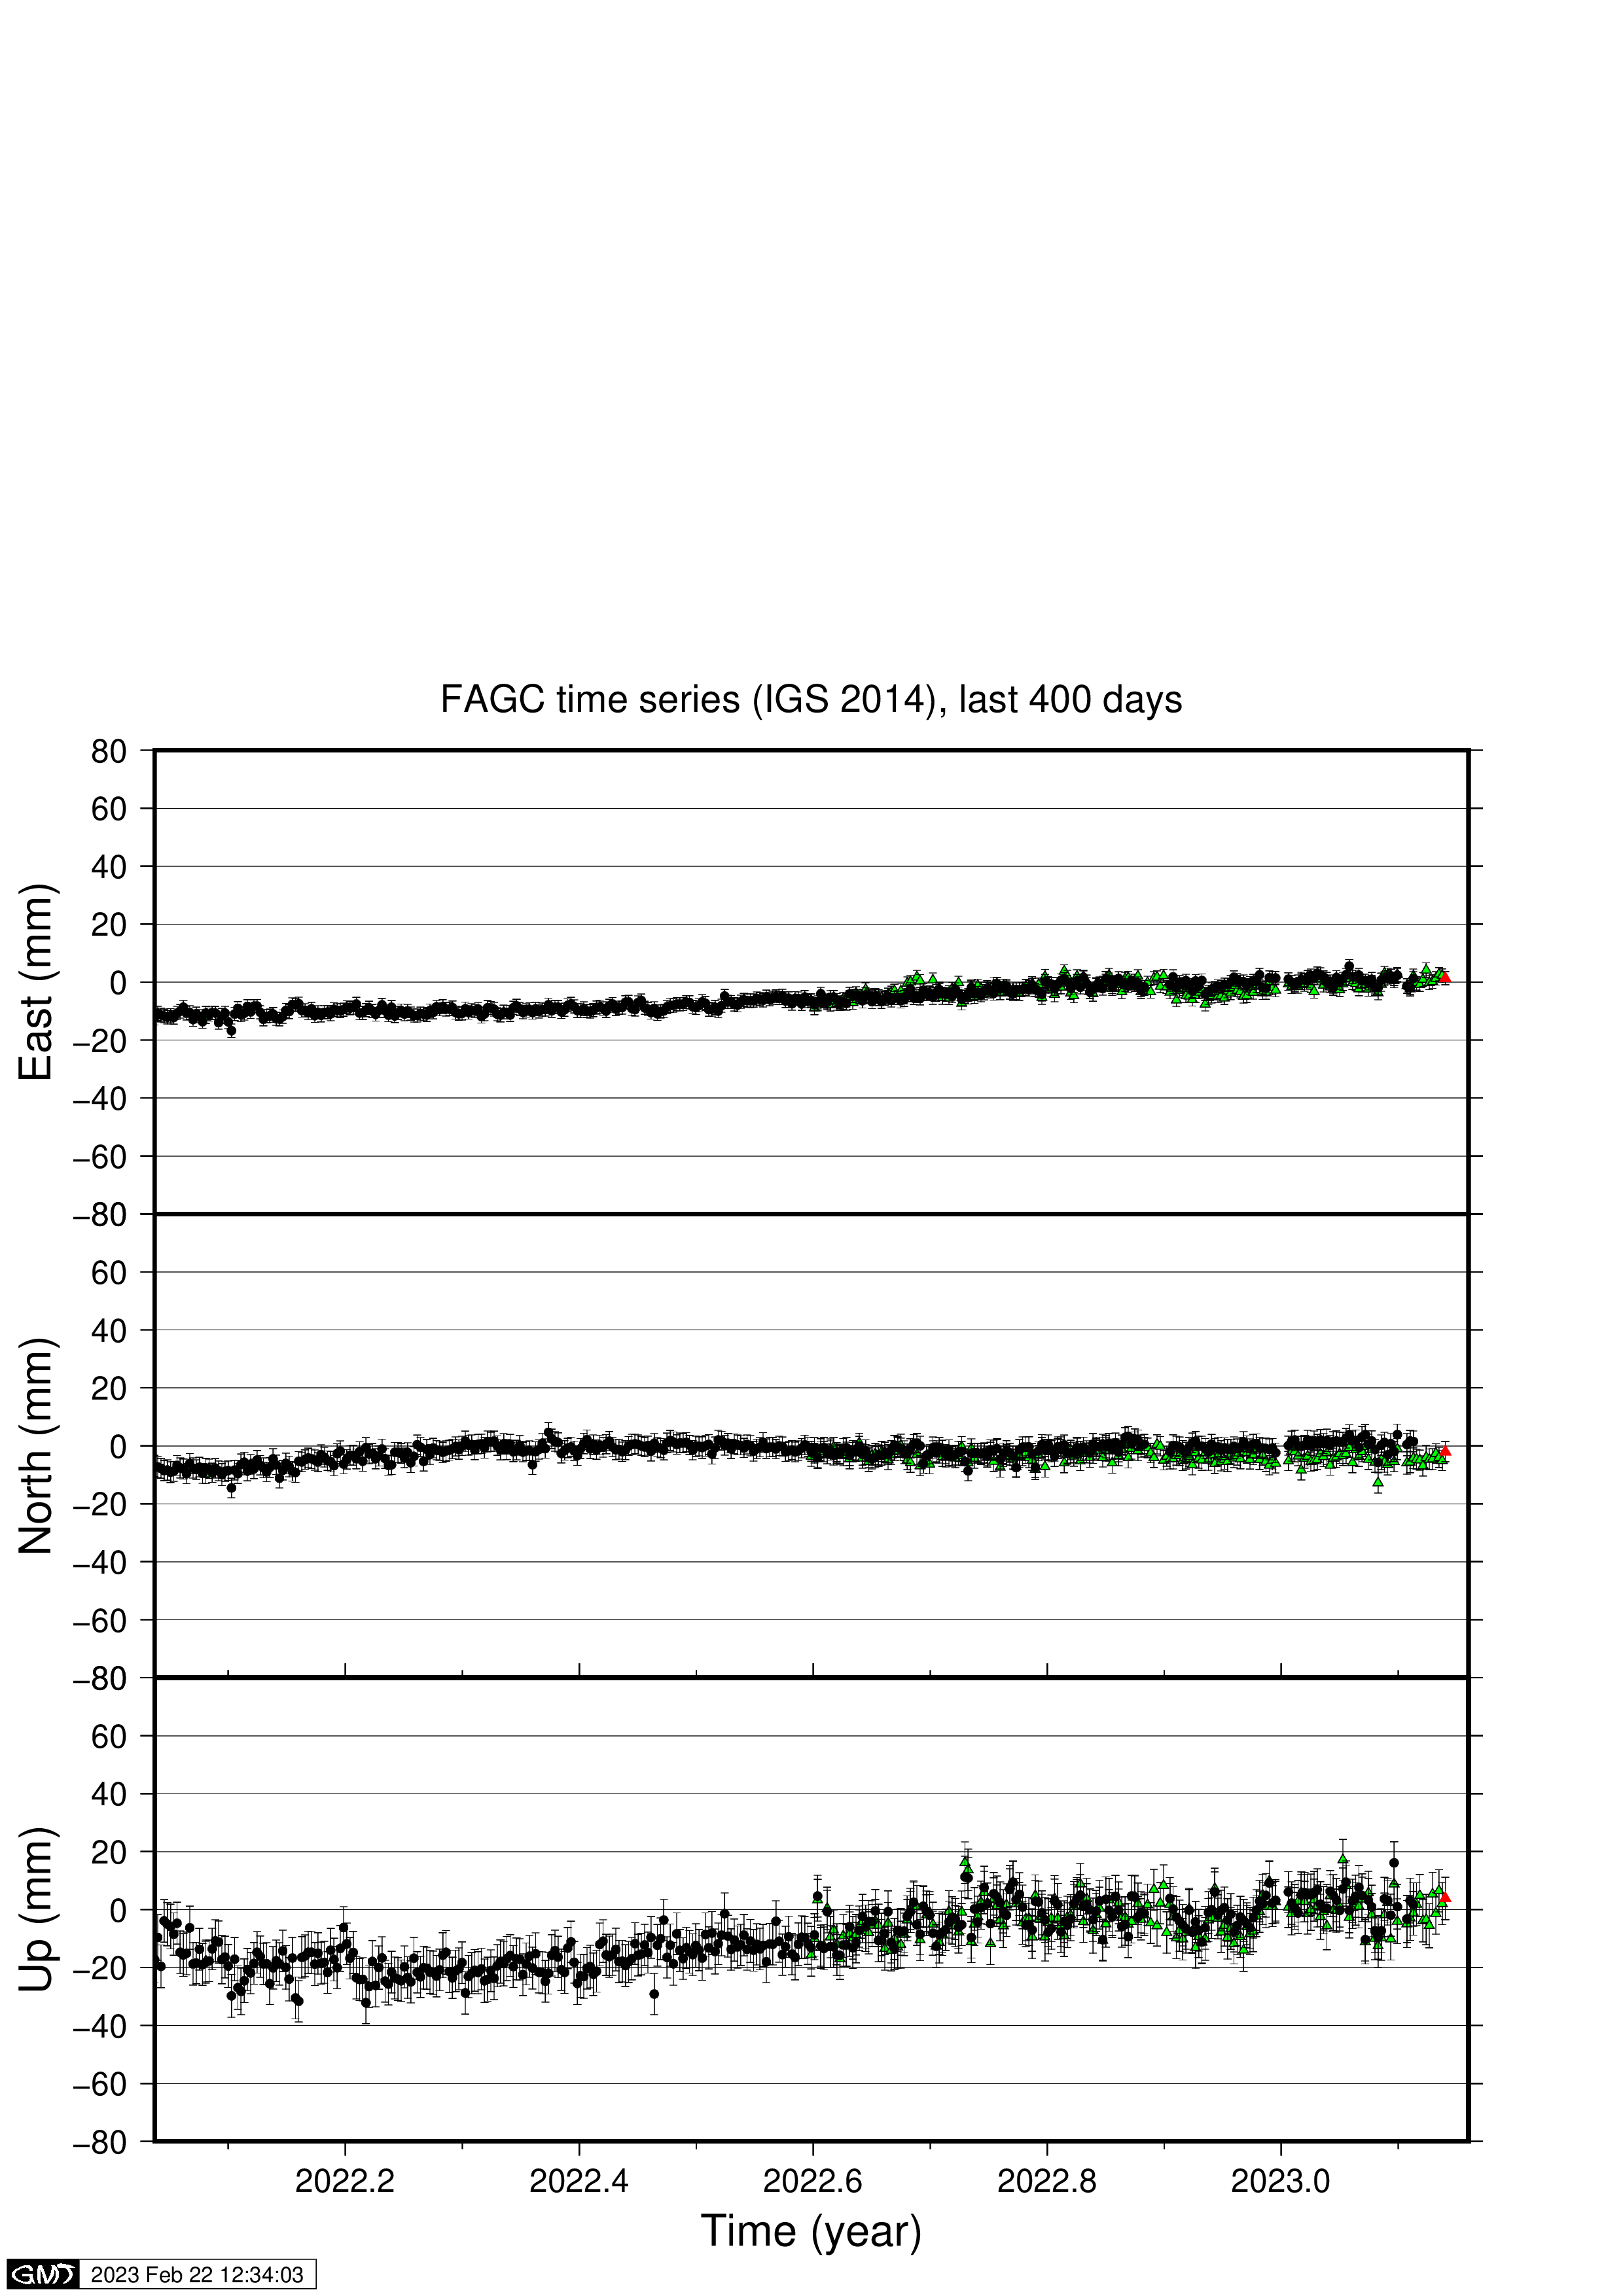

To top of page
INACTIVE: Kinematic processing, positions at 5 minute interval with latency of 2-4 hours typically. Each site has 3 plots, for the last 1, 3, and 10 days. KVSK:


ROTH:


SLEC:


KALF:


To top of page
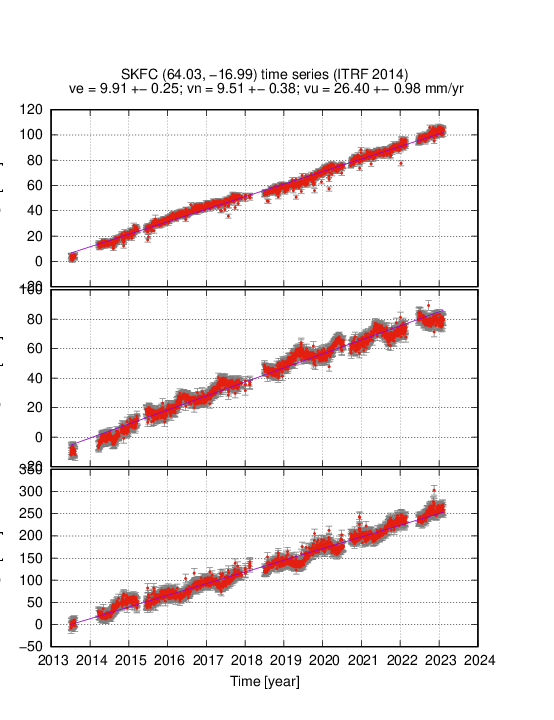
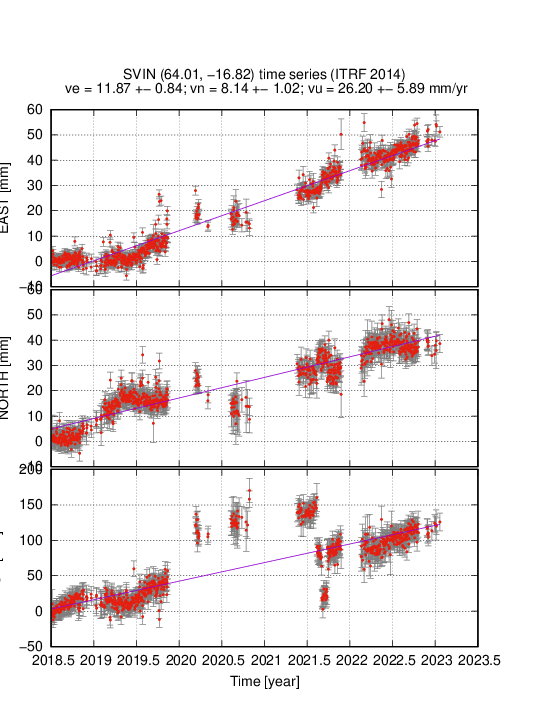
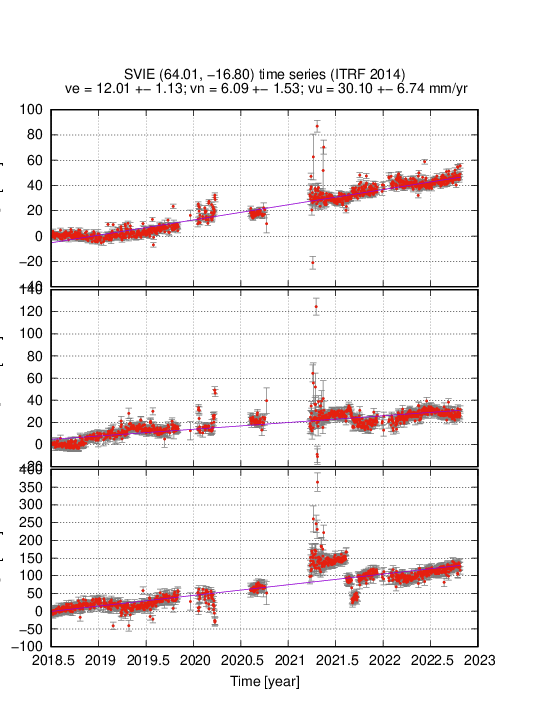
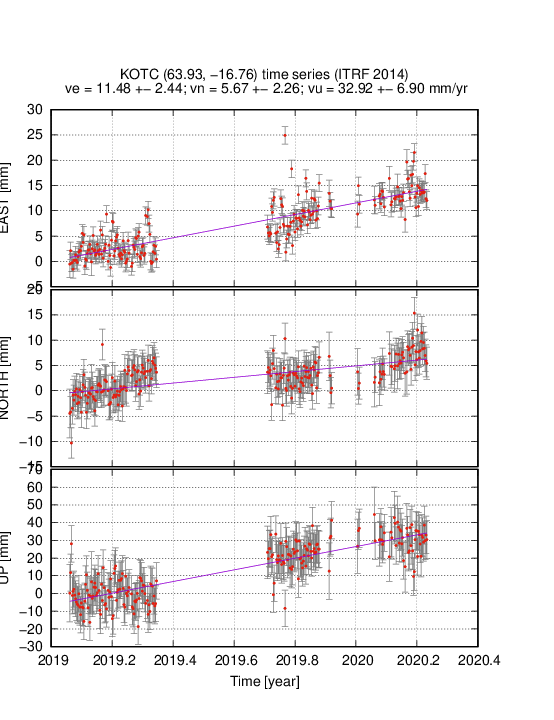
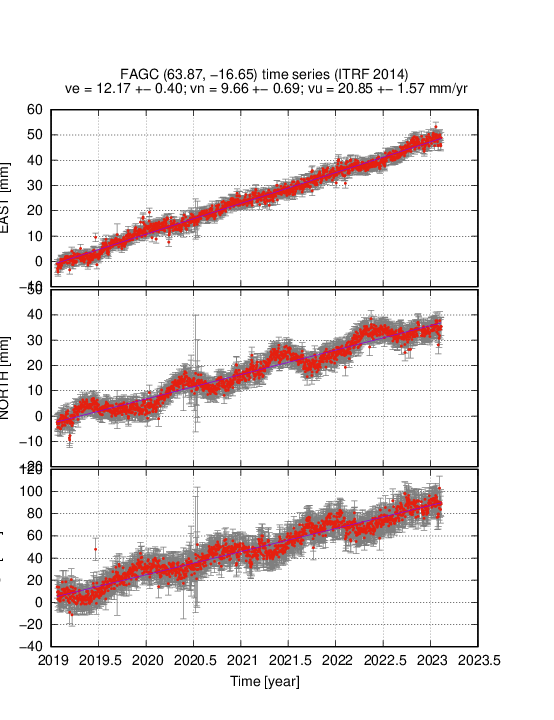
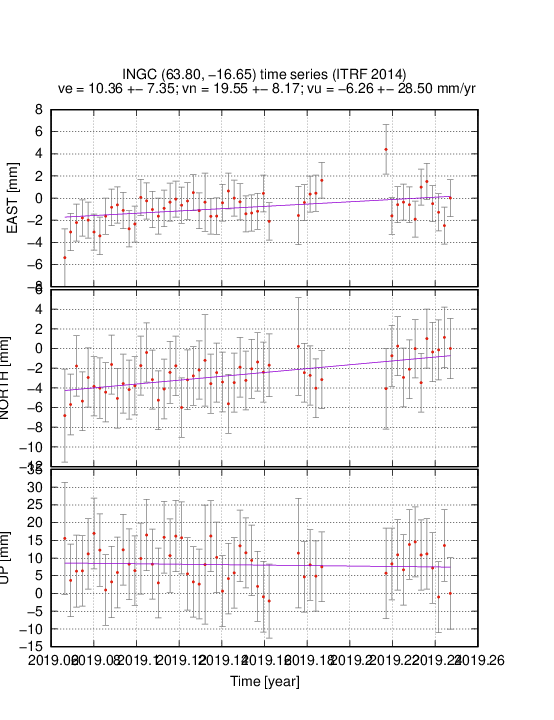
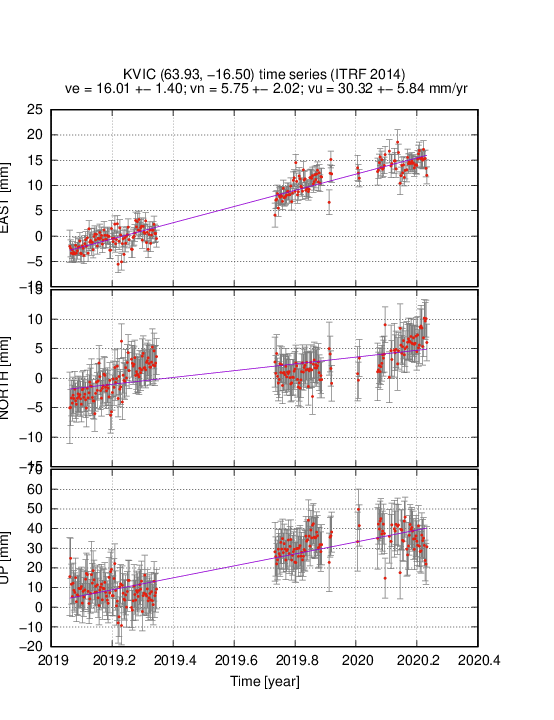
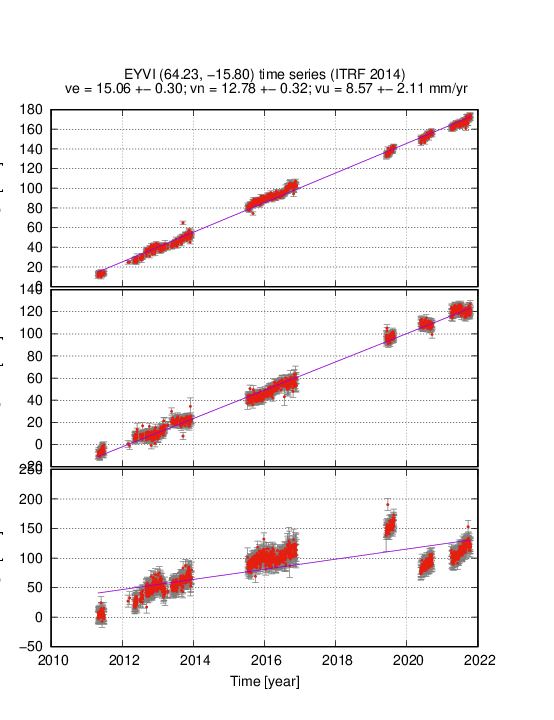
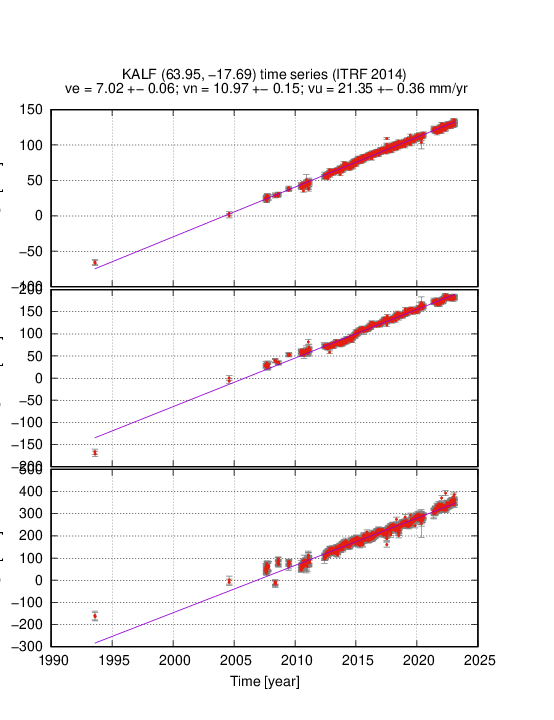
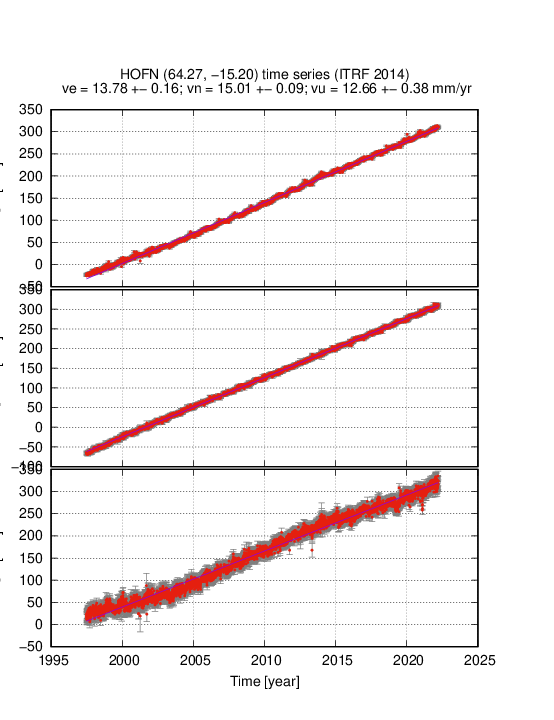
Final time series from start of measurements, in the ITRF2008 reference frame
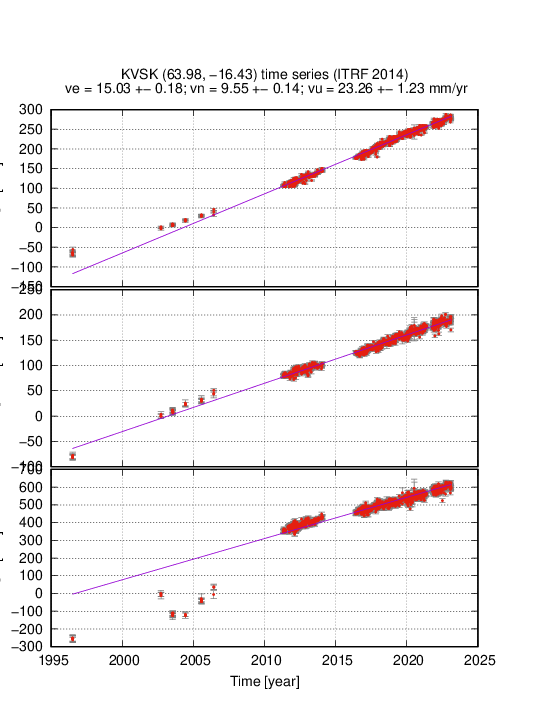
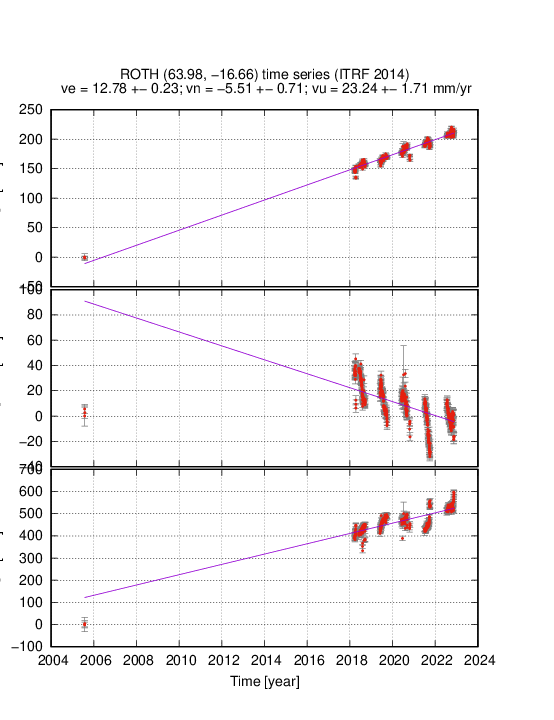

To top of page
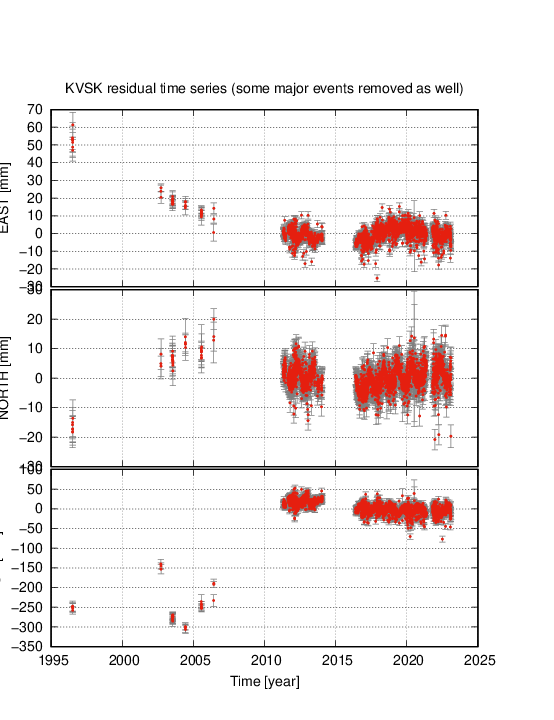
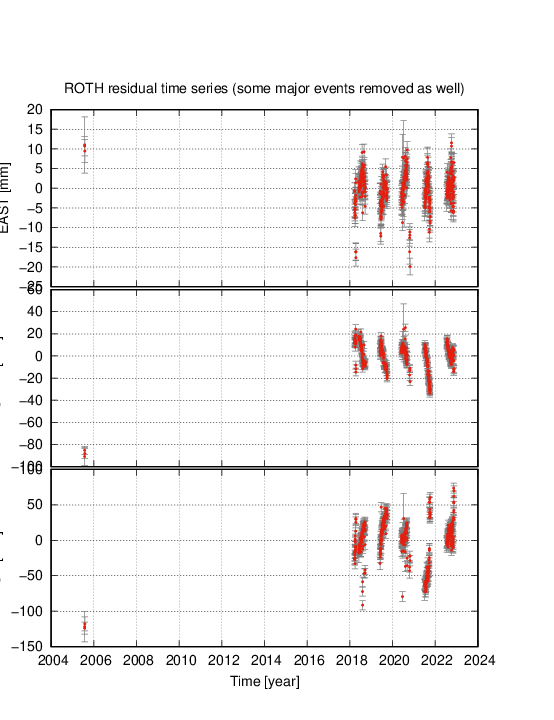
Final time series, average linear trend removed
To top of page
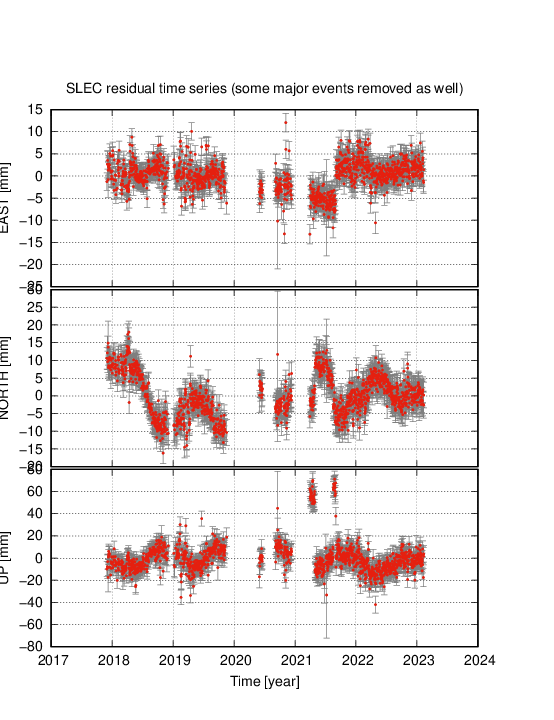
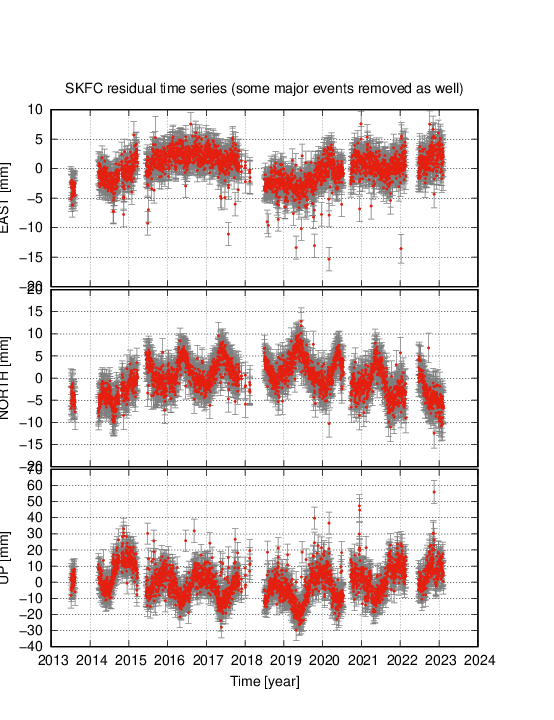
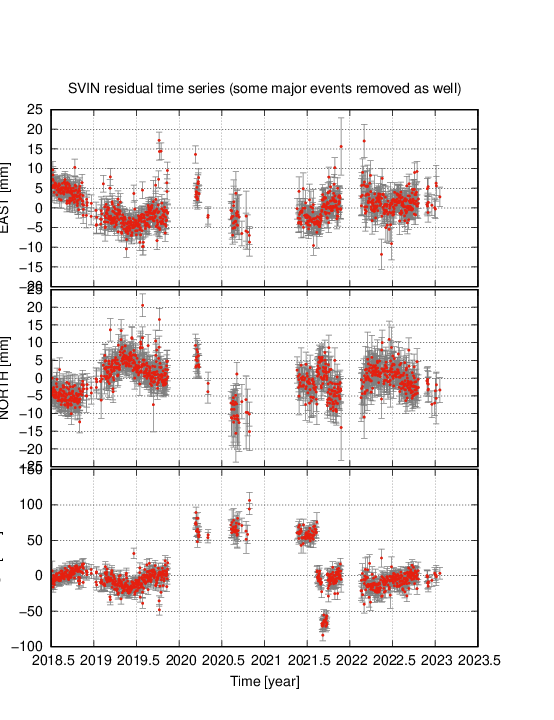
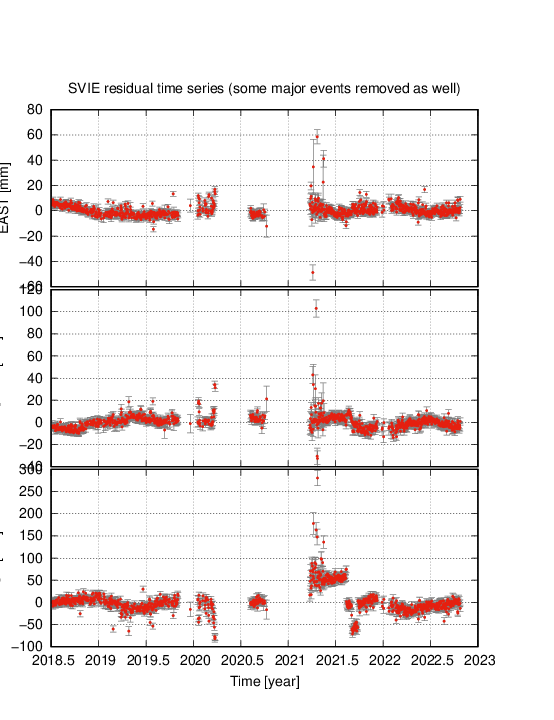
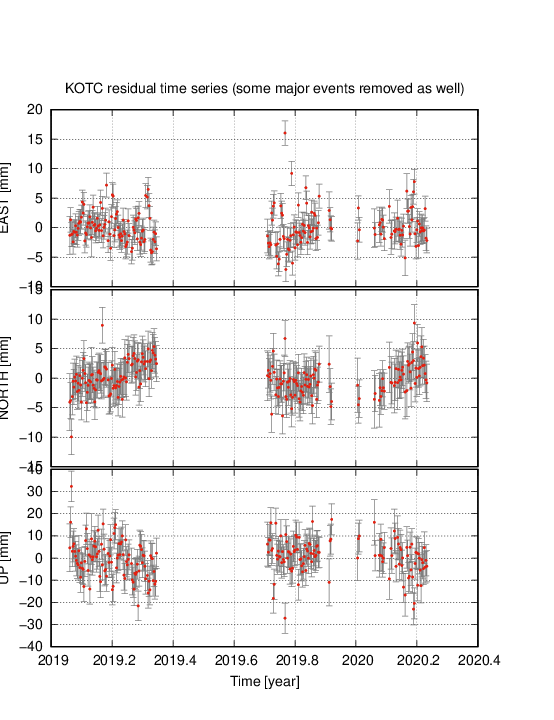
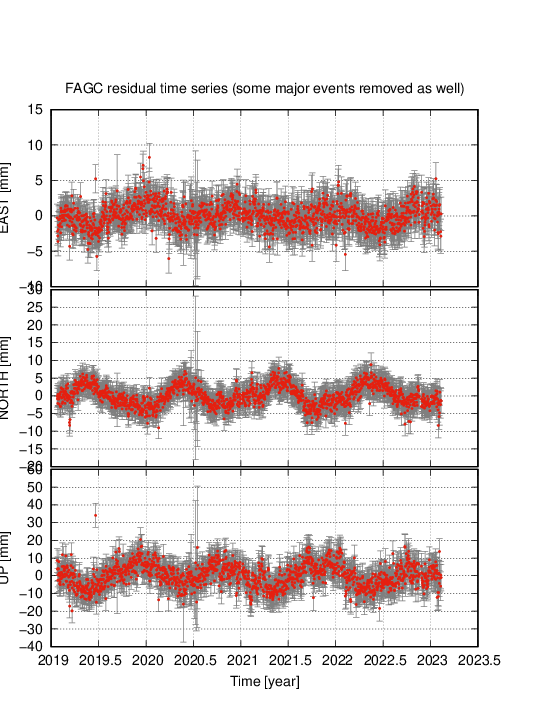
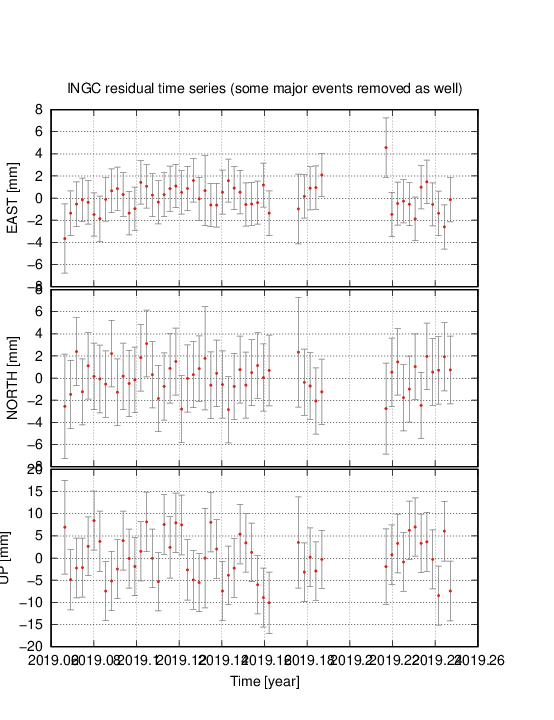
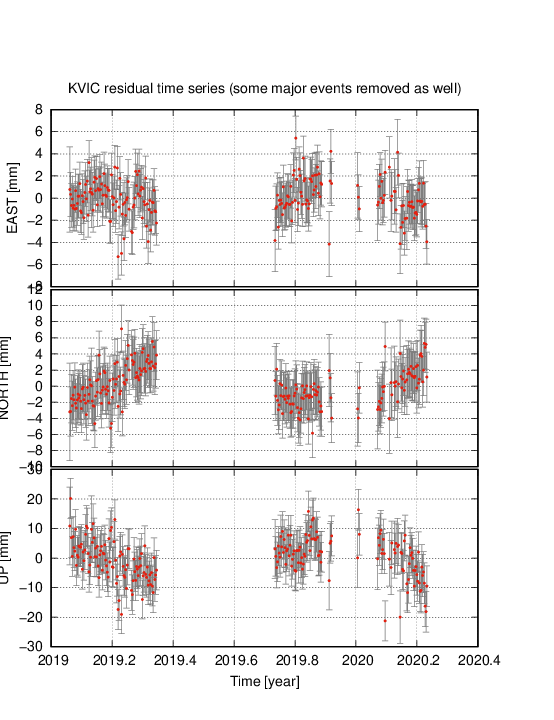
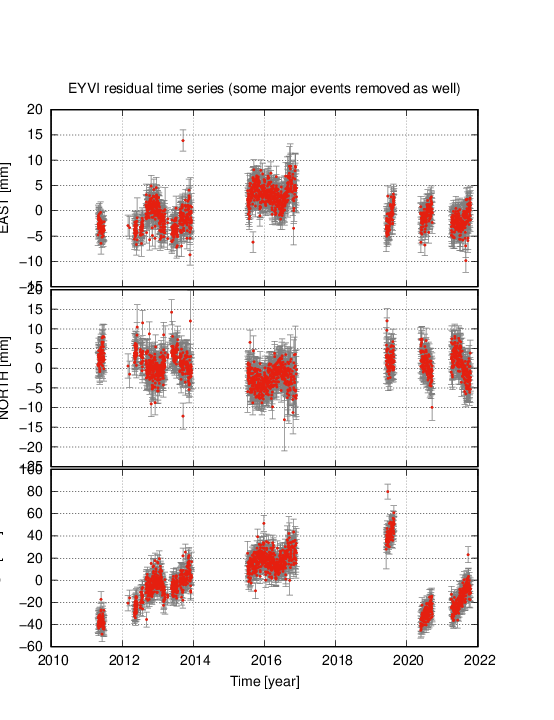
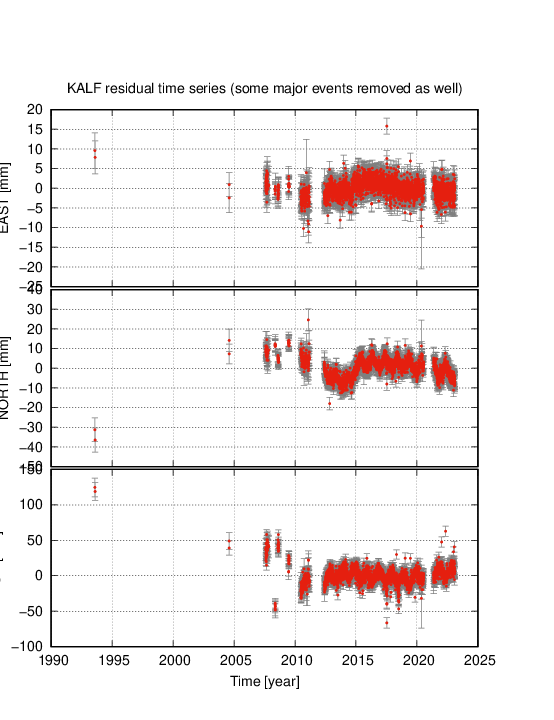
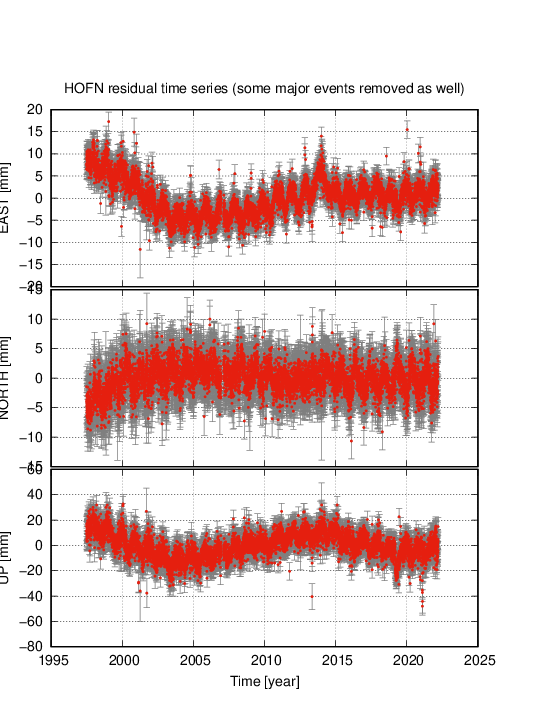
Final time series, average linear trend and seasonal signal removed
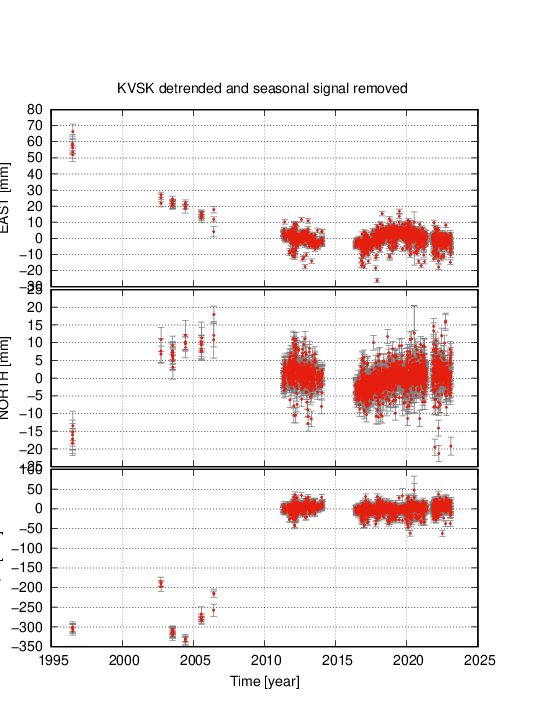
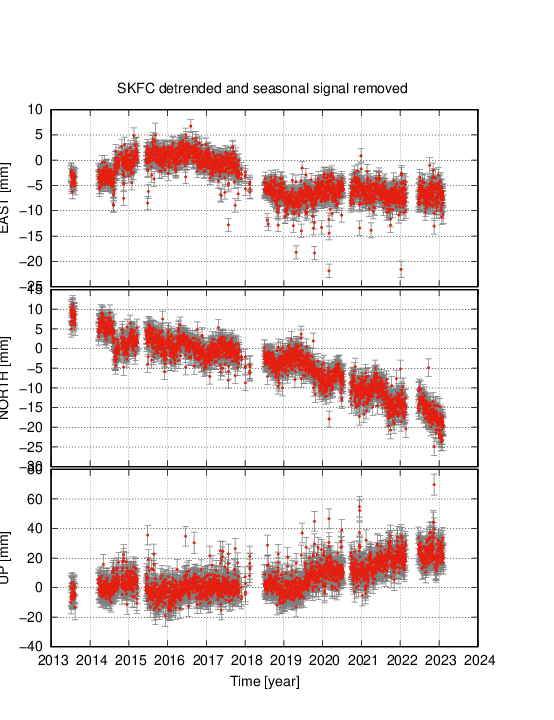
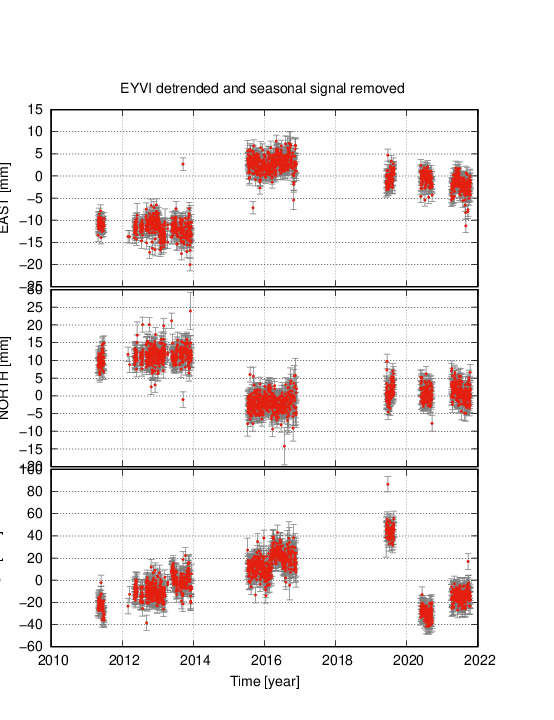
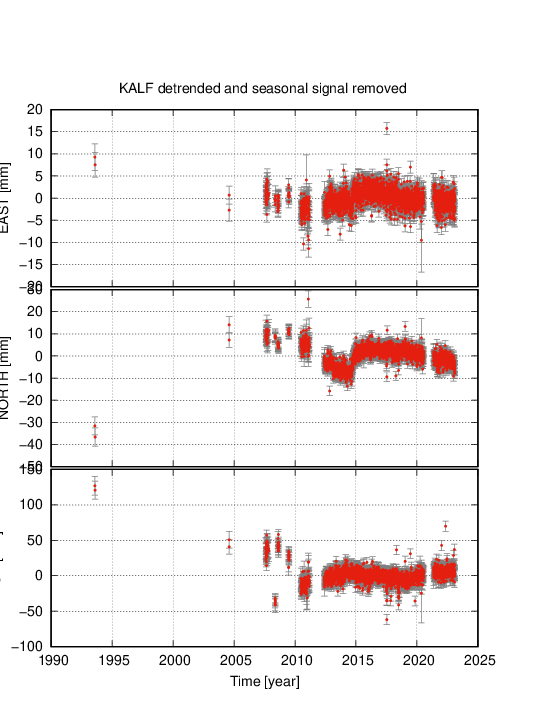
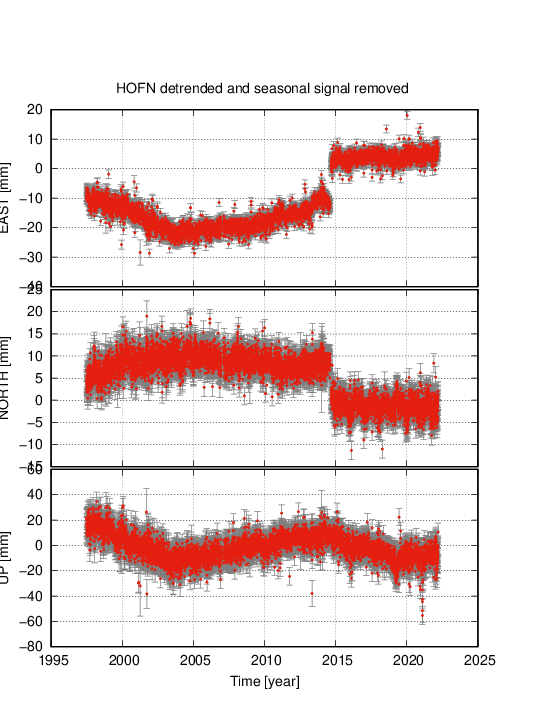
To top of page
Final time series, estimation of seasonal signal
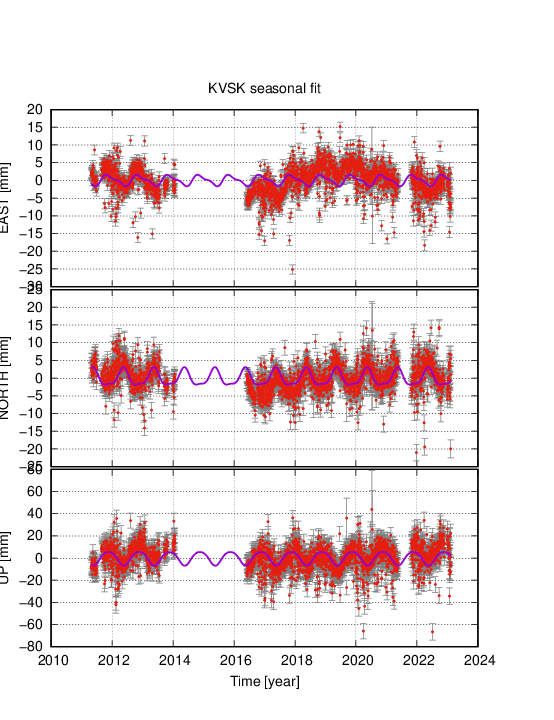
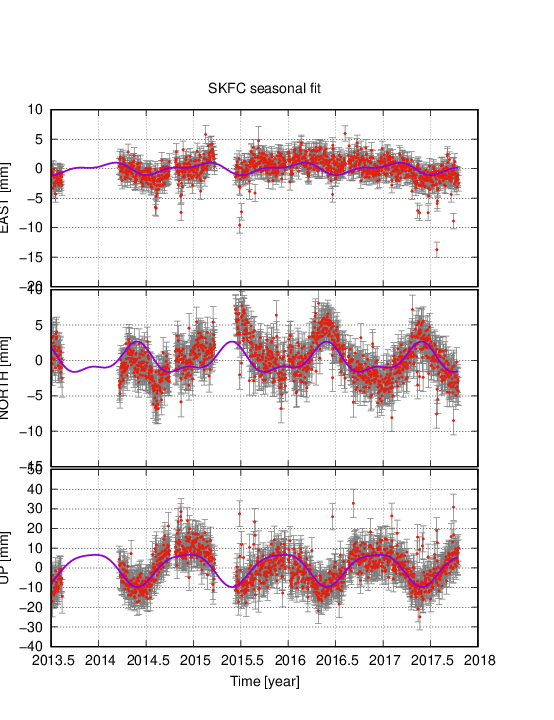
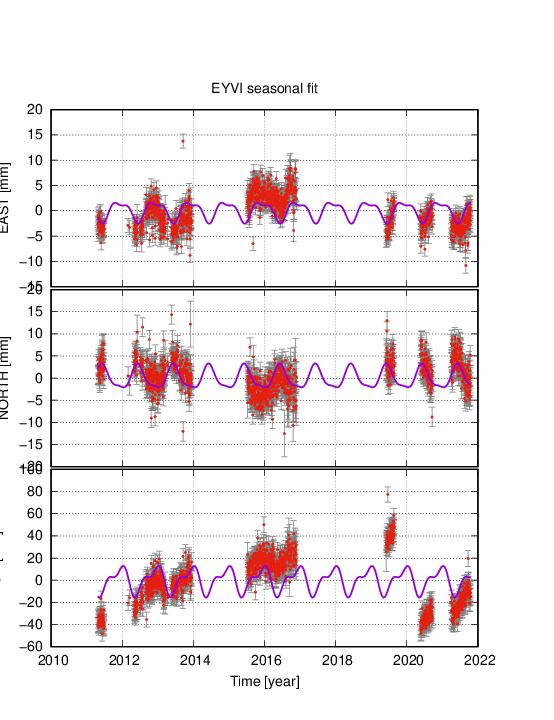
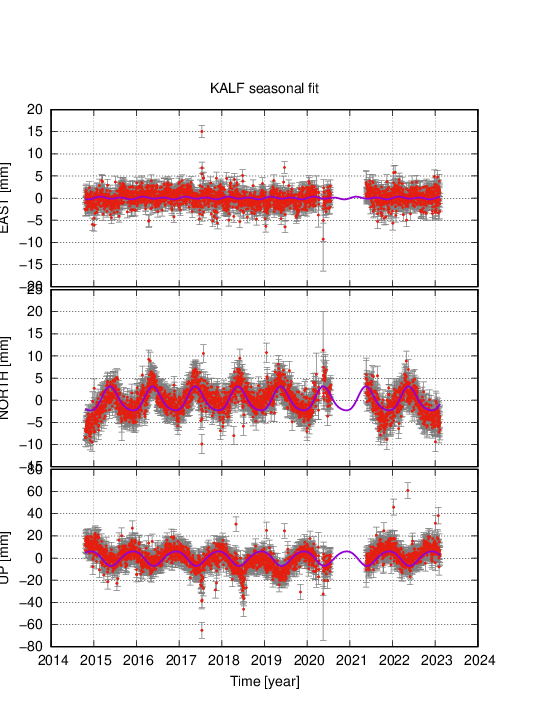

To top of page