
| GPS time series for Krafla |
|---|
|
Results from GIPSY/OASIS PPP single-site "kinematic" processing (5-minute solutions) using JPL ultra-rapid orbits, in the IGb08 reference frame. Results displayed here are for test purposes and currently only include data from selected stations. The plots below show various time scales of the same results. All plots are auto-scaled on the y-axis, so a single point can throw the whole set of plots off-scale. However, that very data point may be important sometime! Because independent orbits are used for each UT day, artifical offsets may be observed at and around midnight. The latency of the results (how far behind real-time) depends on time of data availability (hourly files, available 15 minutes after the last measurement in the file), orbit availability (updated 50 minutes past the hour, but usually not containing satellite clock data covering the last 1-2 hours), processing time (a few minutes), and set time of sync of plots to website. These delays may easily pile up to 2-4 hours. The images are updated on a hourly basis. Click on any image to see it in higher resoltion. Please respect copyright of the results. Last 100 days Last 400 days Last 1-10 days, kinematic solutions (experimental) Final Time series: Final time series Residual (linear signal removed) time series Residual (linear and seasonal signals removed) time series Fit of seasonal signal Final time series including all outliers and offsets (uncorrected) Other plots: Combined plots Site voltage plots |
|
|---|
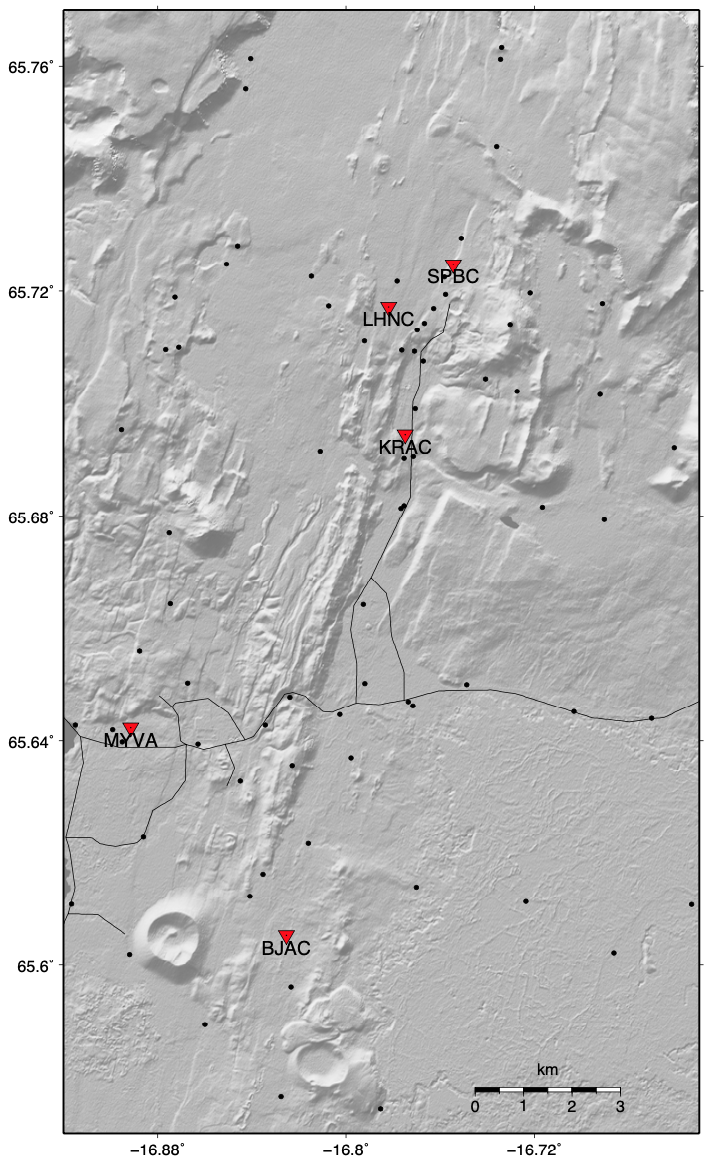
Last 24 hours, Krafla, KRAC LHNC SPBC BJAC MYVA THRC


Last 3 days, Krafla, KRAC LHNC SPBC BJAC MYVA THRC


Last 10 days, Krafla, KRAC LHNC SPBC BJAC MYVA THRC


All available data, Krafla, KRAC LHNC SPBC BJAC MYVA THRC


All available data including bad points (large uncertainties), Krafla, KRAC LHNC SPBC BJAC MYVA THRC


